Yes: its weight in GDP can fall even while its amount rises, and it has fallen elsewhere. In France, from 2016 to 2025, primary deficits, excluding interest, outweighed the relief from interest rates and growth: the debt-to-GDP ratio rose by 18.6 points.
Updated: 3 October 2026 General government, Eurostat series from 1996 to 2025. Download: CSV · JSON · method
Three decades, three regimes
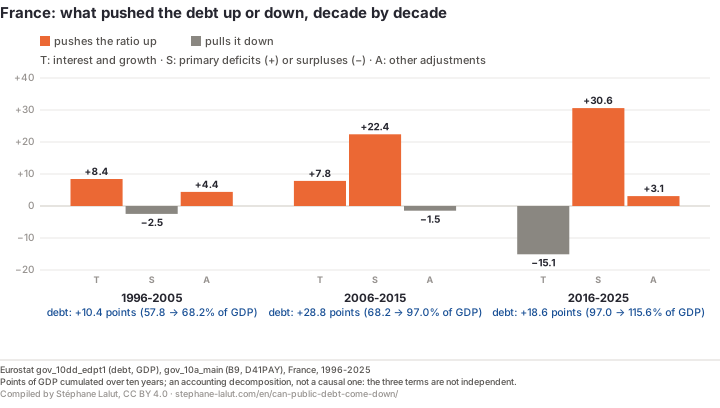
What pushed the French debt-to-GDP ratio up or down, by decade, in points of GDP cumulated (Eurostat). Orange: what pushes it up; grey: what pulls it down.
The finding in one sentence. From 2016 to 2025, primary deficits added 30.6 points to the French debt ratio, the interest-growth effect, concentrated in 2021-2023, took off 15.1, and other adjustments added 3.1: the net result is a rise of 18.6 points. This is an accounting decomposition: it says through which term the debt moved, not why the deficits occurred.
What falls or rises here is the weight of the debt in GDP, not its amount: a ratio can decline while the debt in euros grows, if nominal GDP grows faster. The ratio moves under three terms, set out in Why does French public debt rise?: the interest-growth effect (interest, minus what nominal GDP growth erases), the primary balance (revenue minus spending, excluding interest) and other adjustments, known as “stock-flow” (acquisitions of assets, changes in cash holdings and other operations that change the debt without going through the deficit). Cumulated by decade, the term that pushes the debt changes from one period to the next.
1996-2005: interest rates push, the budget excluding interest is close to balance. The ratio goes from 57.8% to 68.2% of GDP. Over the decade as a whole, the interest-growth effect adds 8.4 points. The primary balance, in surplus four years out of ten, takes off 2.5.
2006-2015: both terms push together. The ratio gains 28.8 points, the largest rise of the three decades: 22.4 from primary deficits, 7.8 from the interest-growth effect. The period includes the 2008-2009 financial crisis.
2016-2025: an interest-growth effect favourable in total, outweighed by primary deficits. Interest adds 17.7 points, nominal GDP growth erases 32.8: in total, the interest-growth effect is −15.1 points. This relief is concentrated in 2021-2023, years of rebound in activity and then inflation, which alone take off 16.8 points; the other seven years together weigh +1.7 points, including +6.1 in 2020, when GDP fell. No year of the decade shows a primary surplus: cumulated deficits add 30.6 points, more than the whole rise of the ratio (+18.6).
From one decade to the next, the contribution of primary deficits went from −2.5 to +22.4 and then +30.6 points. This describes a recurrence; it does not say whether these deficits were avoidable, nor which of their two terms, spending or revenue, explains them.
Countries that started from higher debt
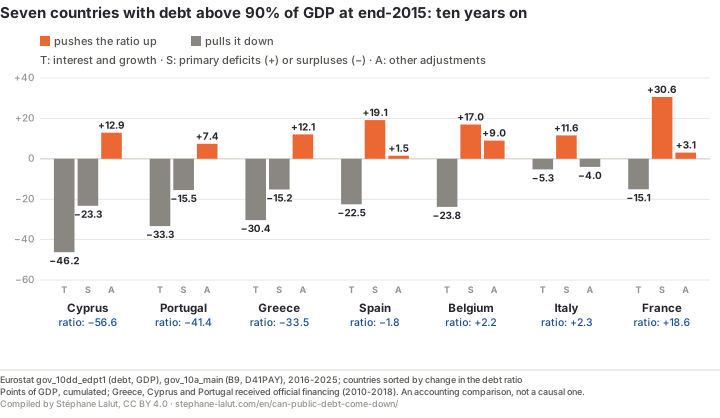
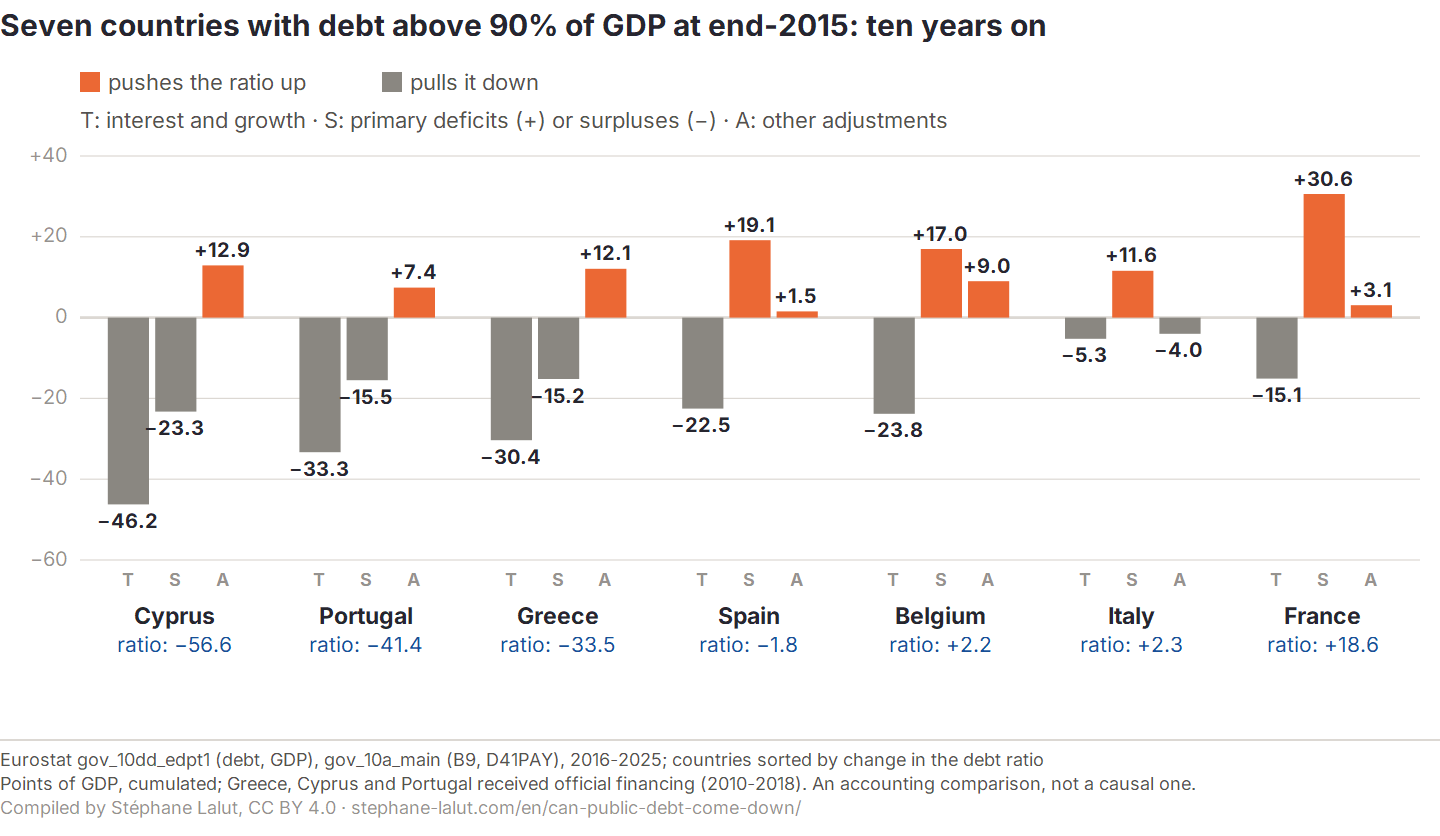
The same decomposition, over the same decade, applies to the EU countries whose debt exceeded 90% of GDP at end-2015: France, at 97.0%, and six others, all starting from higher. This threshold is a presentation convention, close to the French level; it does not make these countries equivalent experiments.
Interest-growth effect (T), contribution of the primary balance (S) and other adjustments (A) to the change in the debt ratio, 2016-2025, in points of GDP cumulated (Eurostat). Countries sorted by change in the ratio.
What the group allows us to say, and what it does not. Within this group, the three large falls in the ratio go together with an average primary surplus. But the favourable contributions of interest rates and growth range from 5 to 46 points: this is not a common environment. And the finding depends on the scope: at 80%, the group has ten countries, adding Austria, Croatia and Slovenia; Slovenia, starting from 83.4%, saw its ratio fall by 17.7 points with an average primary balance of −0.5% of GDP. At 100%, France drops out of the group.
The interest-growth effect pulled the ratio down in all seven countries, by 5 to 46 points over ten years. France’s (−15.1) is not the smallest in the group.
The ratio fell by 33 to 57 points in the three countries whose primary balance was in surplus on average: Cyprus, Portugal and Greece, with an average surplus of 1.5 to 2.3% of GDP. The amount of their debt, however, did not decrease: in Portugal, it went from 235 to 275 billion euros. Their other adjustments, positive, slowed the fall.
It stayed roughly stable for Spain, Belgium and Italy (−1.8 to +2.3 points), with an average primary deficit. In Belgium, the contributions of interest-growth and of the primary balance total −6.8 points; other adjustments add 9.0, bringing the change to +2.2 points.
It rose by 18.6 points in France, the largest rise in the group, with the highest average primary deficit (−3.1% of GDP).
The seven countries, term by term
Country
Debt, end-2015
Debt, end-2025
Change
Interest-growth effect
Cumulated primary deficits
Stock-flow
Average primary balance
Cyprus
111.6
55.0
−56.6
−46.2
−23.3
+12.9
+2.3%
Portugal
131.0
89.7
−41.4
−33.3
−15.5
+7.4
+1.5%
Greece
179.6
146.1
−33.5
−30.4
−15.2
+12.1
+1.5%
Spain
102.5
100.7
−1.8
−22.5
+19.1
+1.5
−1.9%
Belgium
105.7
107.9
+2.2
−23.8
+17.0
+9.0
−1.7%
Italy
134.8
137.1
+2.3
−5.3
+11.6
−4.0
−1.2%
France
97.0
115.6
+18.6
−15.1
+30.6
+3.1
−3.1%
Debt in % of GDP; change and contributions in points of GDP cumulated over 2016-2025; a negative figure under “cumulated primary deficits” means surpluses. Source: Eurostat.
These countries were not financed on the same terms. Portugal (from 2011 to mid-2014), Cyprus (from April 2013 to March 2016) and Greece (from May 2010 to August 2018, with a last programme, financed by the European Stability Mechanism, from August 2015 to August 2018) received official financing from their European partners and the IMF; Spain received, from July 2012 to January 2014, assistance to recapitalise its banks (European Commission; European Stability Mechanism). The restructuring of Greek debt, in 2012, predates the decade studied. The average nominal growth of the three surplus countries exceeded that of France, which increases their interest-growth effect; and a primary balance itself depends on the economic cycle: a fast-growing economy collects more revenue. Seven countries over one decade do not make a general regularity, and the comparison does not isolate the effect of a policy.
What primary balance would stabilise the debt?
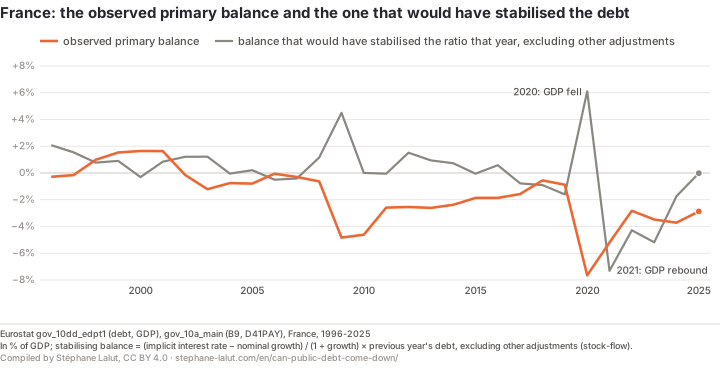
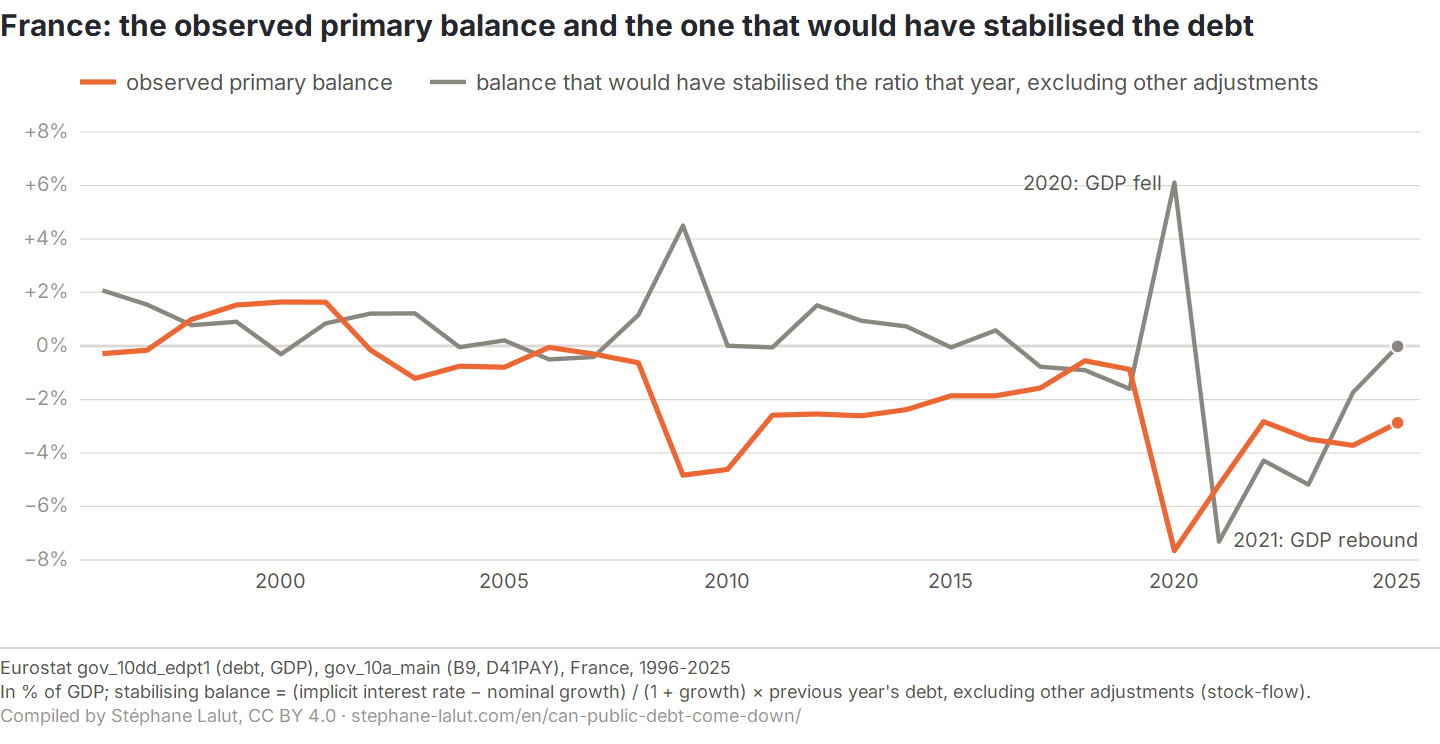
Excluding other adjustments, the debt ratio stays unchanged in a given year if the primary balance offsets that year’s interest-growth effect: this is the benchmark plotted below. It is not a constant: it rises when the interest rate exceeds growth, and turns negative in the opposite case, where a limited primary deficit leaves the ratio stable. Stabilising the observed ratio also requires taking other adjustments into account: in 1998 and 2007, the balance reached this benchmark and the ratio still rose.
Observed primary balance and the primary balance that would have stabilised the debt ratio that year, excluding other adjustments, France, in % of GDP (Eurostat, author's calculation).
In 2025, the implicit interest rate (2.0%) and nominal growth (2.0%) were almost equal: the stabilising benchmark was close to zero. The observed primary balance was −2.9% of GDP, a gap of 2.9 points.
Over 30 years, this benchmark ranged from −7.3% of GDP in 2021, when nominal GDP rebounded, to +6.1% in 2020, when it fell. The observed balance reached or exceeded it in eleven years out of 30. This count measures the years in which the benchmark excluding adjustments was reached; it is not the number of years in which the ratio actually fell, which it did in nine of those years. France ran a primary surplus four times, from 1998 to 2001, at most 1.65% of GDP.
Stabilising the ratio and bringing it down are two different objectives. An adjustment amount is read with its objective, its horizon and its assumptions; the benchmark calculated here for 2025 applies to that year and cannot be used to assess institutions’ multi-year estimates.
Thirty years of European windows
Primary balances and falls in the ratio: European ten-year periods
The comparison above covers a single decade. To place it in a wider set, the same decomposition was applied to every ten-year window of the 27 current EU members, since 1996: 533 windows, which overlap, are therefore not as many independent experiments, and include the decade already compared. This is context, not a counter-test.
Among the 78 windows where starting debt exceeded 90% of GDP:
negative average primary balance: 35 windows, in six countries (Belgium, Greece, Spain, France, Italy and Portugal). The ratio falls in six of them, never by 15 points;
average primary balance from 0 to under 2% of GDP: 30 windows, in five countries. The ratio falls in ten of them, by 15 points or more in eight;
average primary balance of at least 2% of GDP: thirteen windows, in only three countries (Belgium, Cyprus and Italy). The ratio falls in all thirteen, by 15 points or more in seven.
These frequencies describe past periods, in a few countries. They give neither a surplus threshold to reach nor a probability of success: the high-surplus windows mostly start before 2003.
What these data do not say
Measuring the debt. A fall in the ratio does not mean that the amount of debt has decreased. The debt tracked is gross: other adjustments mix asset purchases, loans and valuation changes, and a country that borrows to acquire assets sees its gross debt rise without its financial position worsening by as much.
Economic interpretation. An accounting decomposition, not a causal one: the terms depend on one another, and the observed balance includes the economic cycle; it does not measure an effort. Nothing here says which of spending or revenue should move, nor who would bear the cost: that is the subject of Who really pays for public debt? The interest-growth effect is based on nominal GDP: lowering the ratio through inflation reduces the real value of claims, and that loss is borne by someone.
Scope of the comparison. The 27 current EU members, since 1996; nothing before, nothing outside the Union. The compared group depends on the debt threshold and the decade chosen. Ten country-years out of 805 are excluded by the check described below.
Time horizon. The page describes thirty observed years. The paths forecast by the French government, the European Commission or the IMF are conditional scenarios, which these data can neither confirm nor rule out.
Frequently asked questions
Can French public debt come down?
Interest and primary deficits push the debt-to-GDP ratio up; nominal GDP growth and primary surpluses pull it down; other adjustments work both ways. The ratio falls when these contributions add up to a negative total, even if the amount of debt keeps rising. From 2016 to 2025, the French ratio rose by 18.6 points: primary deficits added 30.6, the interest-growth effect took off 15.1, mostly in 2021-2023. Over the same decade, it fell by 33 to 57 points in three countries that started from higher debt, all with an average primary surplus: Cyprus, Portugal and Greece.
Are growth and inflation enough to bring debt down?
They lighten the ratio when nominal growth exceeds the interest rate paid on the debt, but the effect varies a great deal from year to year: in France, it took off 16.8 points in 2021-2023 and added +6.1 points in 2020. In the seven EU countries whose debt exceeded 90% of GDP at end-2015, it was favourable everywhere, by 5 to 46 points over ten years; none of those that stayed in average primary deficit saw its ratio fall by 15 points.
What primary balance would stabilise French debt?
Excluding other adjustments, it is the balance that offsets that year's interest-growth effect: it depends on the gap between the implicit interest rate on the debt and nominal growth, and on the level of the debt. In 2025, the two rates were almost equal (2.0% and 2.0%): this benchmark was close to zero, against an observed balance of −2.9% of GDP. It varies widely, from −7.3% in 2021 to +6.1% in 2020. Stabilising the observed ratio also requires taking other adjustments into account.
Has France ever run a primary surplus?
Four times since 1996, from 1998 to 2001, at most 1.65% of GDP (Eurostat). Since then, the general government primary balance has been in deficit every year.
Does a primary surplus always bring debt down?
It helps reduce the ratio, but the final change also depends on interest rates, growth and other adjustments: in France, the balance reached the stabilising benchmark excluding adjustments in 1998 and 2007 without the ratio falling. In the ten-year windows of the 27 current EU members where starting debt exceeded 90% of GDP, falls of at least 15 points number none out of 35 with a negative average primary balance, eight out of 30 with a balance from 0 to under 2%, seven out of thirteen with a balance of at least 2%; these windows overlap and come from a few countries.
In the public debt dossier
Where these figures come from
Eurostat, general government (S.13), ESA 2010 accounts, in national currency: Maastricht debt and nominal GDP as published with the deficit and debt notification (gov_10dd_edpt1), interest paid and net lending or borrowing (gov_10a_main, D41PAY and B9). The primary balance is the general government balance plus interest paid. The identity is the one set out in Why does French public debt rise?; annual terms are cumulated over ten years, from the end of the year before the decade to the end of its last year. A year’s stabilising balance is that year’s interest-growth effect, excluding other adjustments. Changes and totals are computed before rounding: displayed figures may differ by 0.1 point.
Check: for each country and each year, the calculated debt ratio and primary balance are compared with those Eurostat publishes as a percentage of GDP, which the calculation does not use. Beyond a gap of 0.11 point, the year is excluded and counted (ten out of 805, listed in the JSON file); for France and the compared countries, the script stops. A window containing a year of nominal growth above 35% (hyperinflation, series break) is excluded. The countries compared with France are designated by a rule, not chosen: debt above 90% of GDP at end-2015; the same calculation is redone at 80% and 100%. No figure on this page is entered by hand: all come from the same script, which checks the main quantitative statements and stops if their conditions are no longer met; their wording is reviewed editorially.
Reusing this page
The charts, the data and a ready-made citation, under an open licence. Each chart carries its source, vintage and reading caveat inside the image: reused in a lecture or an article, it does not come apart from what makes it readable.
France: what pushed the debt up or down, decade by decade
From one decade to the next, the term pushing French debt up changes; over the last one, interest and growth pulled it down and primary deficits pushed it up by more.
Reading caveat. Points of GDP cumulated over ten years; an accounting decomposition, not a causal one: the three terms are not independent.
Eurostat gov_10dd_edpt1 (debt, GDP), gov_10a_main (B9, D41PAY), France, 1996-2025
Seven countries with debt above 90% of GDP at end-2015: ten years on
Among countries that started from debt at least as high, the interest-growth effect was favourable everywhere; debt fell where the primary balance was in surplus on average.
Reading caveat. Points of GDP, cumulated; Greece, Cyprus and Portugal received official financing (2010-2018). An accounting comparison, not a causal one.
Eurostat gov_10dd_edpt1 (debt, GDP), gov_10a_main (B9, D41PAY), 2016-2025; countries sorted by change in the debt ratio
Lalut, Stéphane (2026). “Can public debt come down?”. Eurostat data, retrieved October 3, 2026. https://stephane-lalut.com/en/can-public-debt-come-down/
In three sentences
From 2016 to 2025, primary deficits added 30.6 points of GDP to the French debt ratio, the interest-growth effect, concentrated in 2021-2023, took off 15.1, and other adjustments added 3.1: a rise of 18.6 points. Among the seven EU countries that started above 90% of debt at end-2015, the falls of more than 15 points are those of the three countries with an average primary surplus, a finding that depends on the threshold chosen. This is an accounting decomposition, not a causal attribution.
The data
The decade-by-decade decomposition of the French debt-to-GDP ratio, the observed and stabilising primary balance (excluding other adjustments) year by year, and the same decomposition for the EU countries that started above 90% of GDP; the same content exists as CSV, in long format.
Data and charts CC BY 4.0 — free reuse, including commercial, with attribution. Text under copyright — short quotation free, full reproduction on request. The raw series belong to their producers (Eurostat), under their own terms.