In 2025, French general government owes 66.6 billion euros of interest, 4.3% of its revenue, and 124% more, in euros, than at the 2020 trough. The rise is fast, but the level is not unprecedented: as a share of GDP, the burden is back to its 2014 level and remains below its 1995 level. For twenty-five years the debt doubled as a share of GDP while its bill fell. This page explains why, where the rise comes from, and why it can last even if the debt stops growing.
France is a useful case well beyond France itself. It is a large advanced economy where a general mechanism became unusually clear: for three decades the debt stock grew while the cost of carrying it fell, so the burden stayed quiet — and then, within a few years, the scissors began to close. What happens when that reversal arrives is now playing out in public, on a scale large enough to make the mechanism visible.
To the question “what does the debt cost”, the most direct figure is not the stock but the interest due each year: 66.6 billion euros in 2025, or 2.2% of GDP and 4.3% of public revenue (out of every 100 euros of revenue, 4.3 go to interest). It is a gross burden, for general government as a whole (central government, local authorities, social security), recorded in the year the interest falls due (Eurostat, D41PAY).
The scissors effect: twenty-five years of offset, then the turn
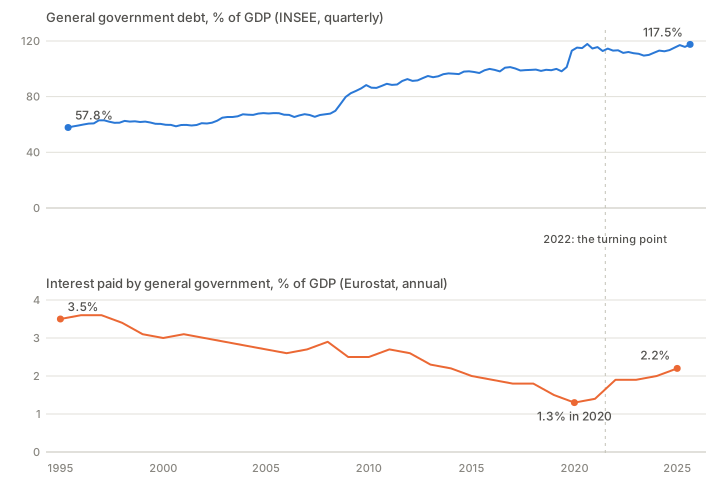
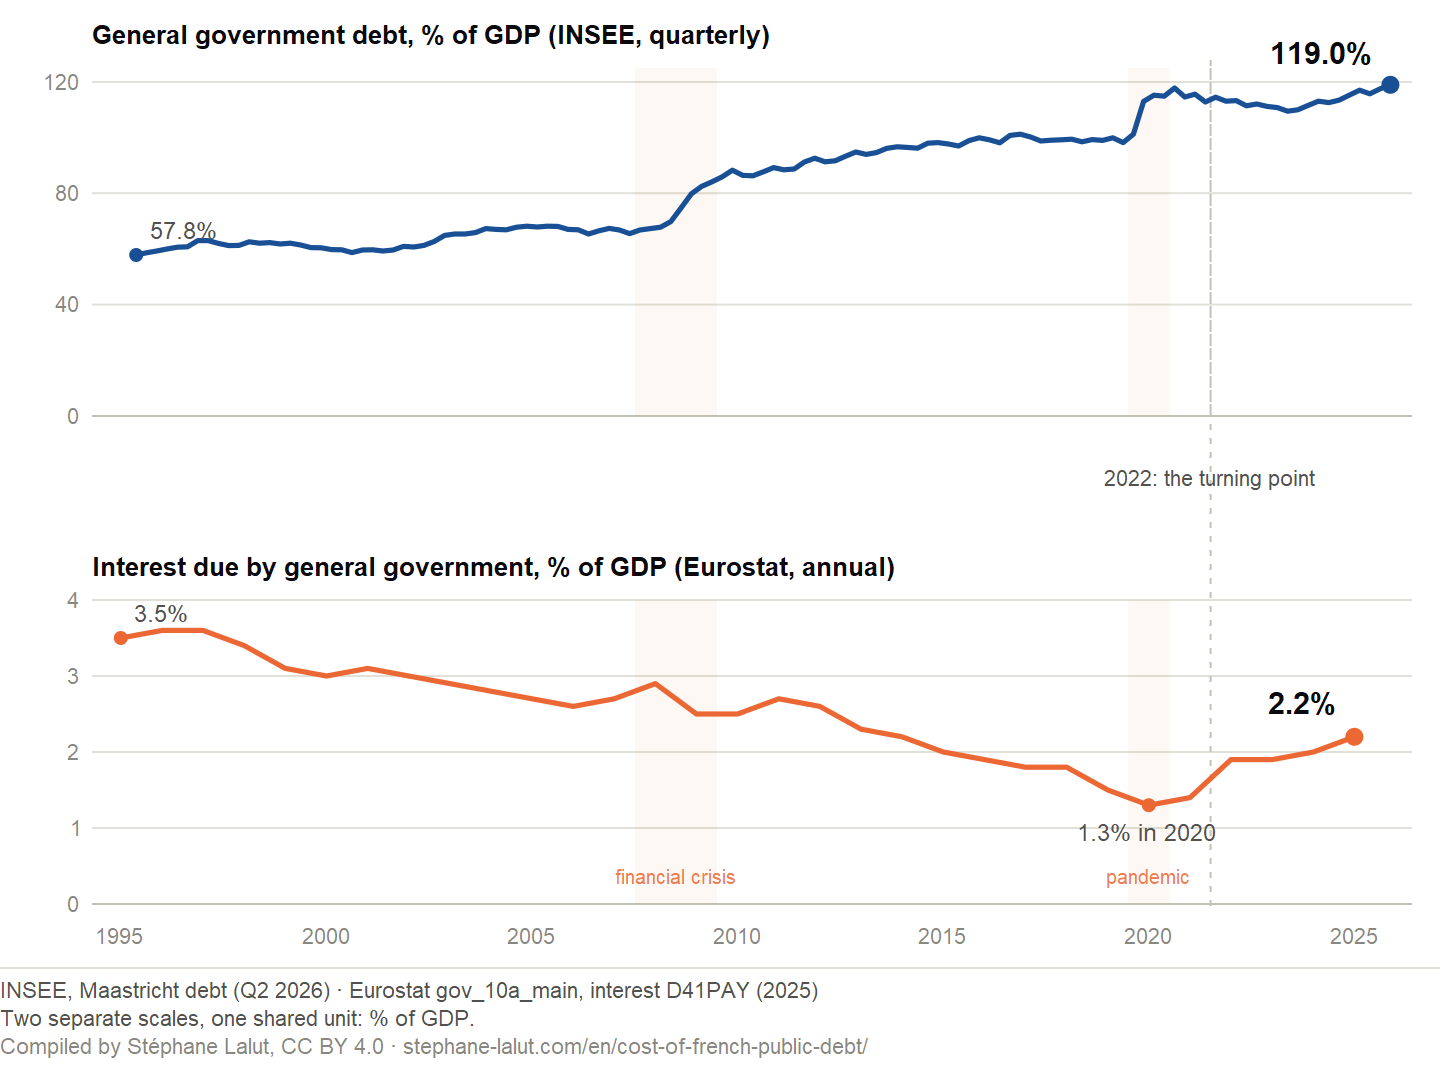
Public debt (Q2 2026: 119.0% of GDP, INSEE, quarterly) and the interest burden of general government (2025: 2.2% of GDP, Eurostat, annual). Two separate scales, one shared unit: percent of GDP.
From 1995 to the turn of the 2020s the two curves open like a pair of scissors, until the interest burden bottoms out in 2020 (29.7 billion euros).
The result in one sentence. From 1995 to 2020, the debt rose from 57.8% to over 100% of GDP while its interest burden fell from 3.5% to 1.3% of GDP: the falling average cost of the stock offset the rising stock. Since then, the two forces have been pulling in the same direction again.
What makes the bill
the stockaccumulated debt, constantly refinanced×its average costthe implicit interest rate=the interest burdendue every year
The stock grows with deficits; the average cost follows market rates only as securities are renewed.
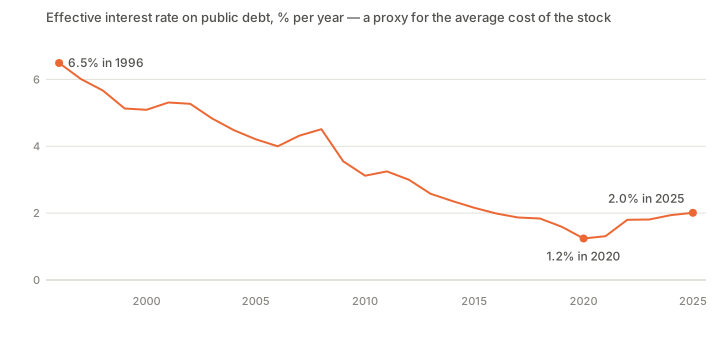
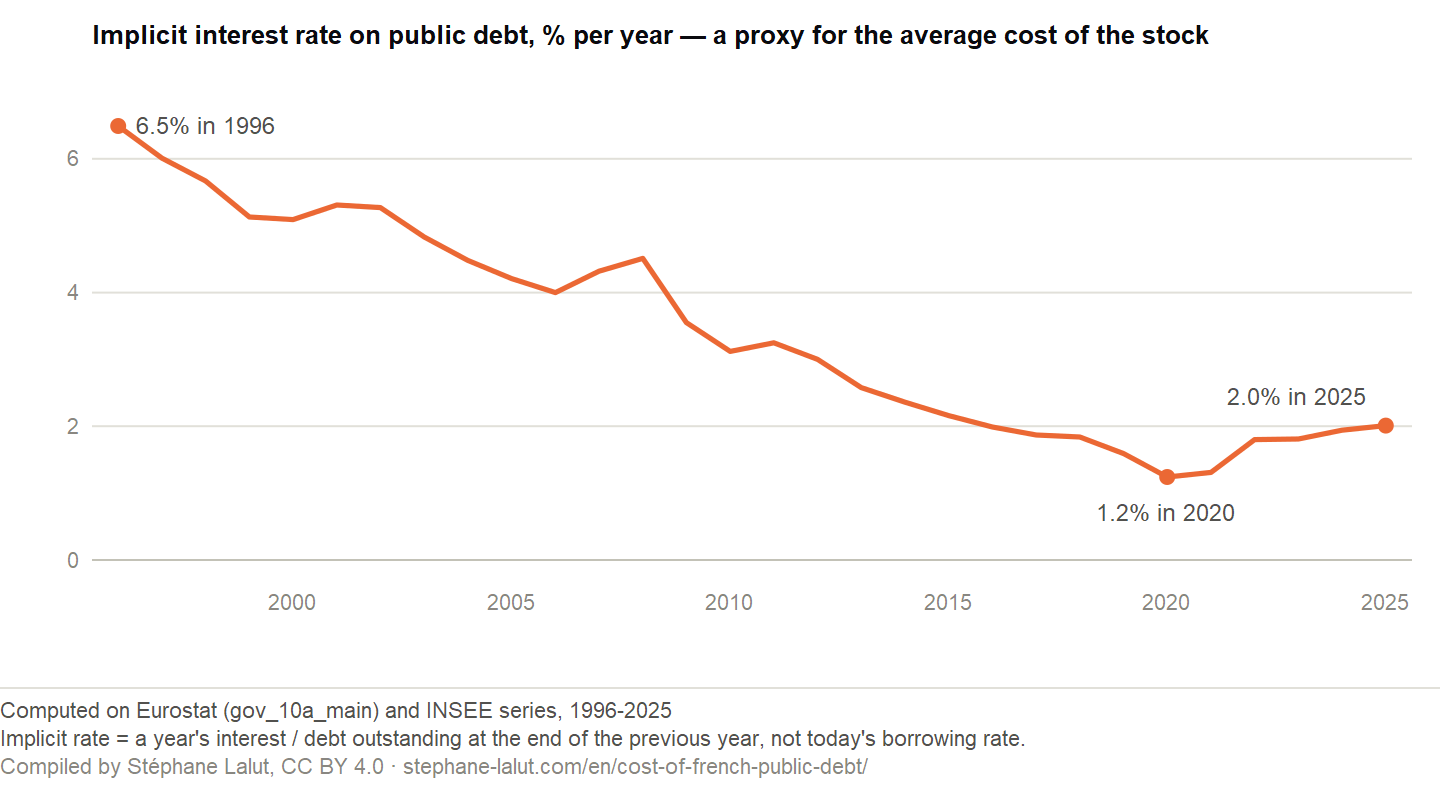
The implicit interest rate is a year’s interest divided by the debt outstanding at the end of the previous year. It is a proxy for the average cost of the stock, not the rate at which France borrows today. For twenty-five years its fall offset the rising stock: that is why doubling the debt did not double the bill.
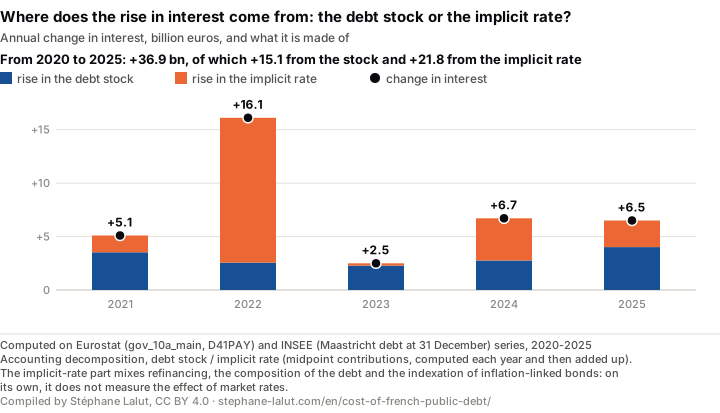
Where has the rise since the trough come from: the debt stock or the implicit rate?
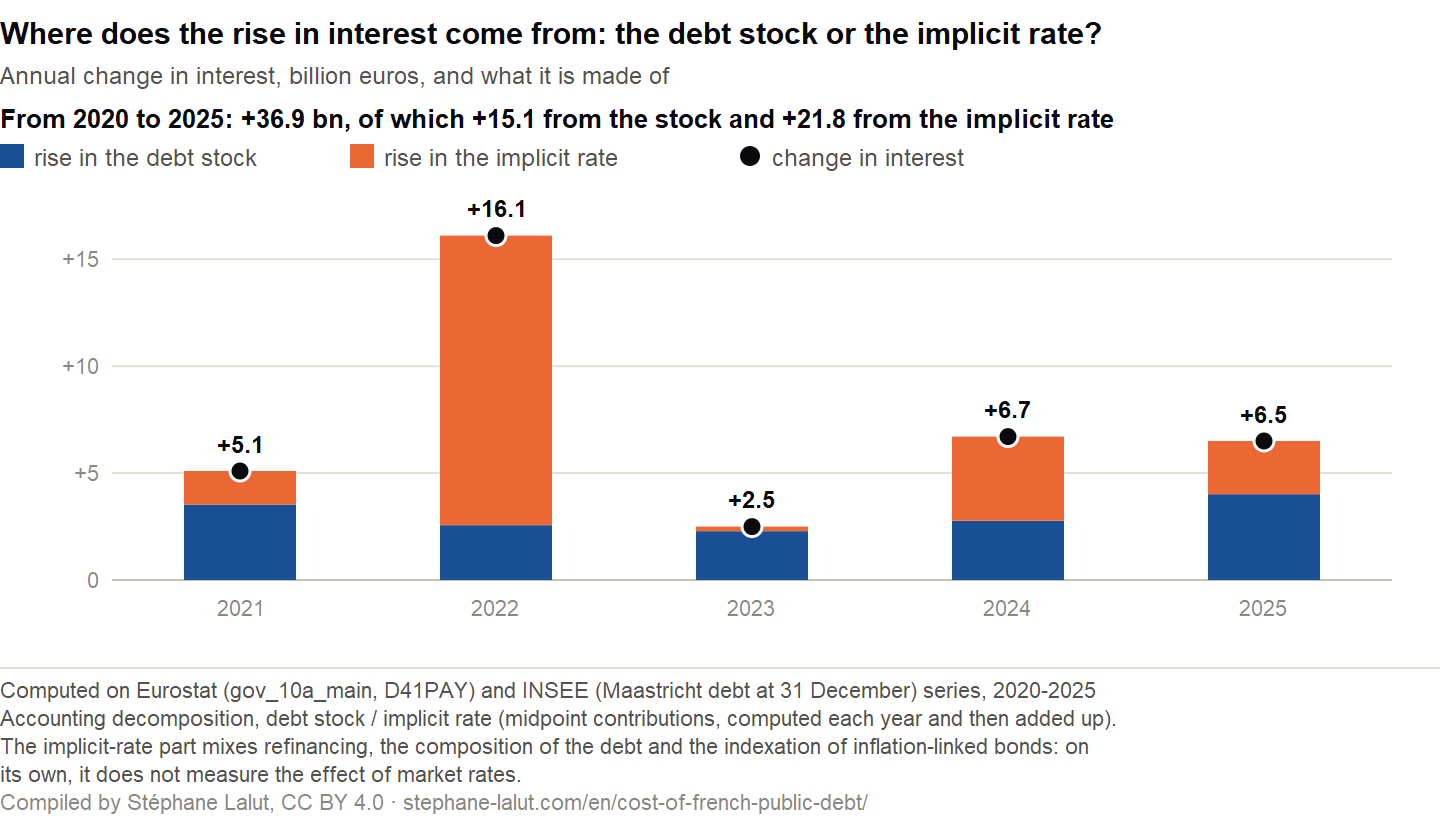
Accounting decomposition of the annual change in the interest burden between the rise in the debt stock (blue) and in the implicit rate (orange), in billion euros; the black dot is the change. Computed on Eurostat and INSEE series.
From 2020 to 2025, the interest burden rises by 36.9 billion euros. Since it is the product of the stock and the implicit rate, its rise splits into two parts: 15.1 billion come from the larger stock, 21.8 from the higher implicit rate, or 59% of the rise. That second figure measures the rise in the average cost of the stock, not the effect of market rates: it is an accounting split, which says how much each term weighed, not why the average cost rose.
The split depends on the starting year. Since 2019, before the pandemic, the burden has risen by 29.7 billion, of which 16.1 from the stock and 13.6 from the implicit rate: the stock then weighs most, because 2020, when the average cost fell, enters the calculation. Starting from the trough enlarges the rate’s share; both bases are exact, and neither alone says what “drives” the rise.
The implicit rate made most of its move in a single year. In 2022, it goes from 1.31% to 1.80%, and the burden rises by 16.1 billion, of which 13.5 are attributed, in accounting terms, to the higher implicit rate. Inflation meanwhile raised the cost of the State’s inflation-linked bonds, a cost recorded as soon as it accrues, as the French Senate’s report on that year’s accounts notes. But these series do not measure the share of indexation in those 13.5 billion, nor do they separate it from refinancing and other changes in the composition of the debt.
Since 2022, the larger stock has weighed most. From 2022 to 2025, the burden rises by a further 15.7 billion, of which 9.1 from the stock and 6.6 from the implicit rate, which now rises only slowly.
These series cannot separate the causes of the rise in the average cost. Its rise mixes three possible causes: securities renewed at higher rates, a differently composed debt, indexation to inflation. The indexation amounts published for the State cannot be added to this calculation, which covers general government as a whole.
Why do market rates not pass through at once?
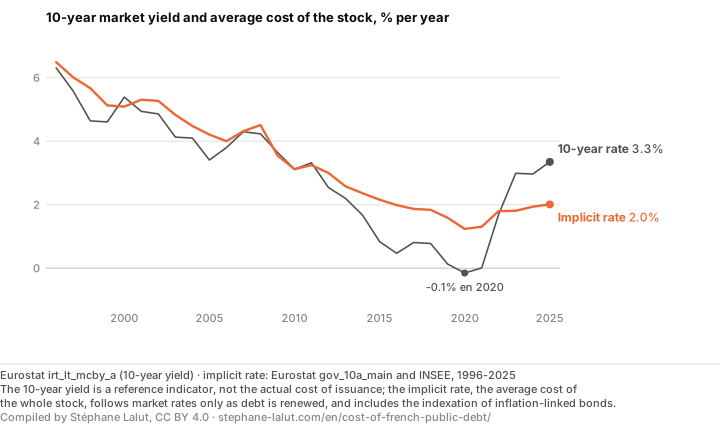
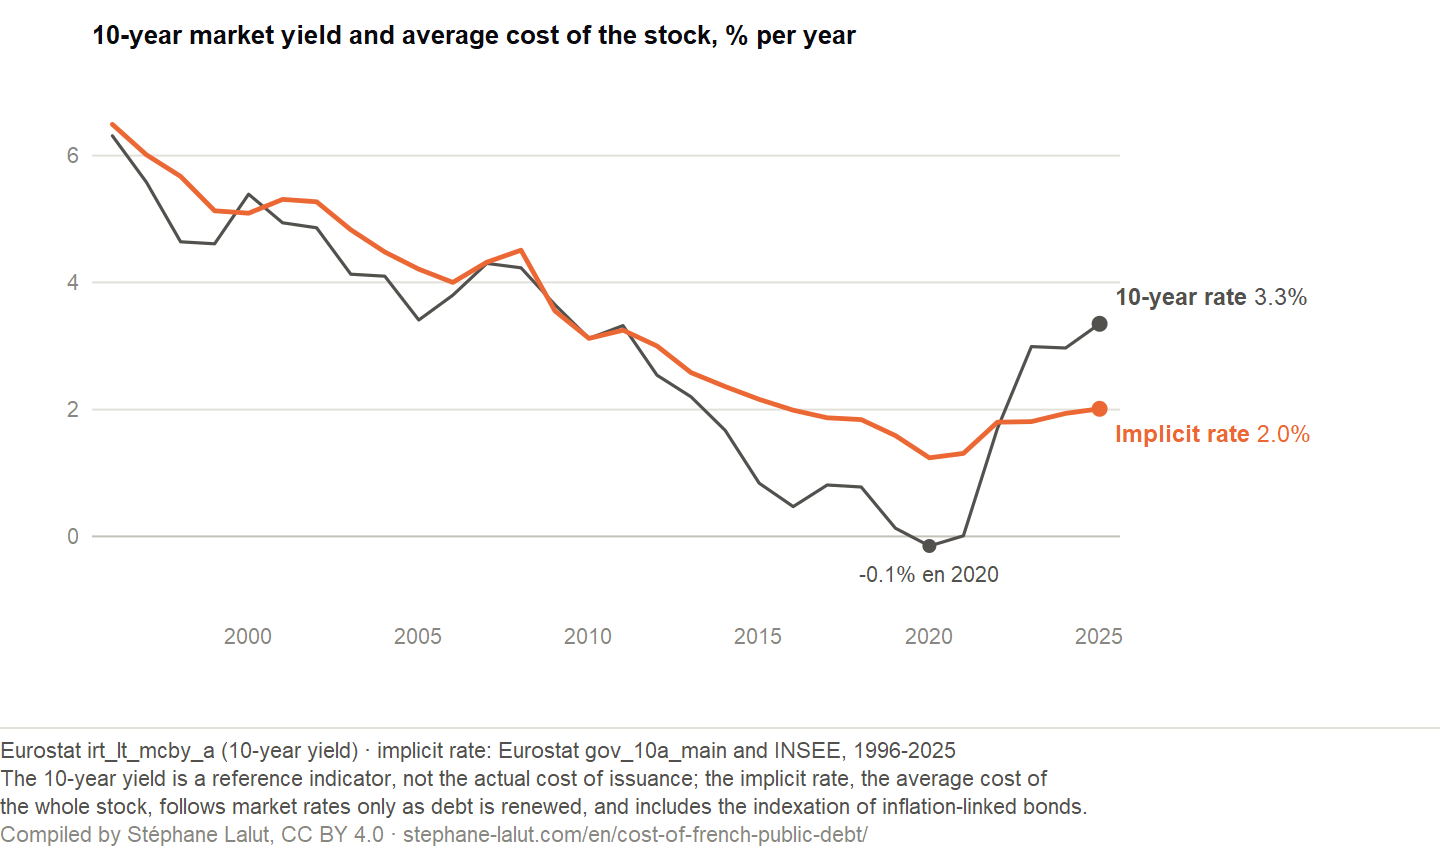
The 10-year yield, an annual average and a reference indicator of borrowing conditions (not the actual cost of issuance), and the implicit rate, the average cost of the whole stock, on the same scale — Eurostat irt_lt_mcby_a and gov_10a_main, INSEE.
A given year’s interest pays for securities issued at different dates, at different rates. The implicit rate therefore follows market rates only as securities are renewed: it went from about 6.5% in 1996 to 1.2% in 2020, not as low as the 10-year rate, and has climbed back only to 2.0% in 2025, when the 10-year rate stands at 3.3%: a security renewed at that rate costs more than the stock’s average. As long as old securities, issued at low rates, mature and are renewed at higher ones, the average cost can keep rising even if market rates settle.
Two mechanisms, two speeds. Inflation-linked bonds pass inflation on to the burden within the year; the renewal of securities passes market rates on only as they mature, over several years. Both show up in the same interest figures, and these series do not separate them.
Three benchmarks measure these two channels. They concern the State’s debt, while the burden on this page covers general government as a whole, and give the order of magnitude of the lag, not its exact timetable.
The average maturity of the State’s negotiable debt: 8 years and 142 days at the end of August 2026 (Agence France Trésor). It does not mean waiting 8 years: part of the securities mature every year, and short-term bills are renewed within months.
Inflation-linked bonds: 314 billion out of 2,904 at the same date, or 10.8%. Their cost follows prices without waiting for repayment: according to the Government, as reported by the Haut Conseil des finances publiques, one more point of inflation adds about 3 billion to the burden in the same year.
Sensitivity to rates: according to the same source, a permanent one-point rise in all rates would add 3.4 billion to the burden in the first year and 8.1 in the second, then more as securities are renewed. This is a sensitivity scenario, not a forecast.
The implicit rate alone, from 1996 to 2025: a twenty-five-year fall, a low in 2020, a jump in 2022
Implicit interest rate: a year’s interest divided by the debt outstanding on 31 December of the previous year — computed from Eurostat (gov_10a_main) and INSEE series. The apparent cost Eurostat publishes uses the year’s average debt instead. The full series is in dette_officielle.json.
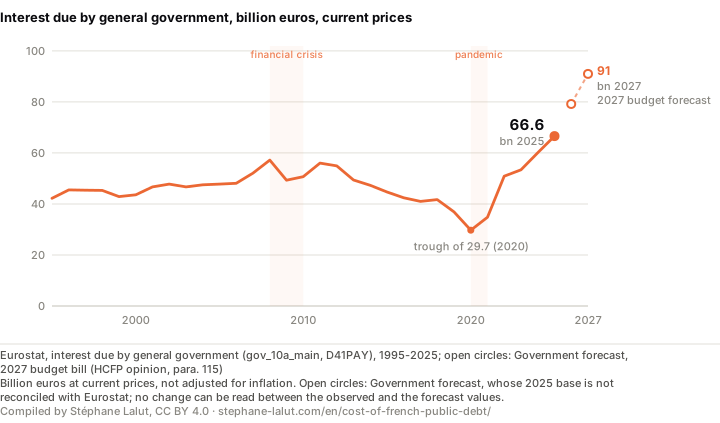
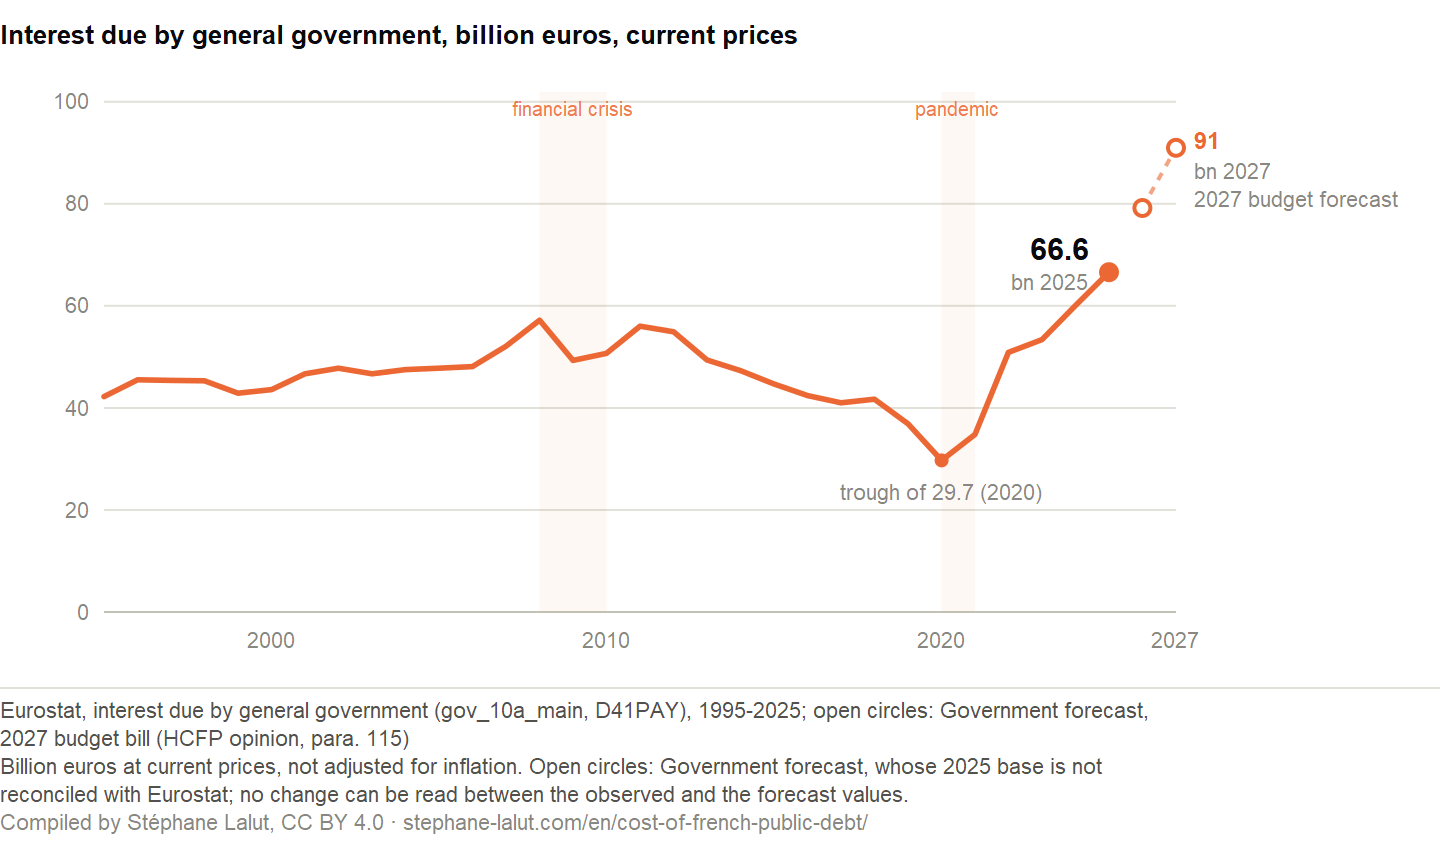
The level is not unprecedented; the rise is fast. As a share of GDP, the burden went from 1.3% in 2020 to 2.2% in 2025. The 2025 burden is thus back, as a share of GDP, to its 2014 level; as a share of public revenue (4.3%), to its 2013 level. In 1995 it amounted to 3.5% of GDP and 6.8% of revenue. But since the 2020 trough it has risen by 124% in euros, and by 80% since 2019: both baselines lead to the same conclusion. The two findings hold together, and refute both “the debt costs almost nothing” and “debt has never cost so much”.
Eurostat, interest due by general government, at current prices not adjusted for inflation; open circles: Government forecast, on a base not reconciled with Eurostat.
Gross, then net. General government also receives interest: 3.9 billion in 2025. The balance between interest due and interest received is 62.7 billion, up 114% since 2020: the conclusion does not change. That balance is not a “net economic cost” of the debt; it only deducts the interest received.
About €1,620 of interest per tax household: an arithmetic division, neither a tax each household owes nor the actual distribution of the burden
On the scale of a household. Divided among France’s 41 million tax households (2023 incomes, filed in 2024, DGFiP), the 2025 interest burden comes to about €1,620 per household. This is a notional, uniform division of the total: it is not a tax owed by each household, and it says nothing about who bears the burden — households, firms and non-residents contribute to public revenue in proportions this calculation ignores. Who bears it is the subject of Who really pays for public debt?
60.1 billion euros of interest in 2024: what order of magnitude?
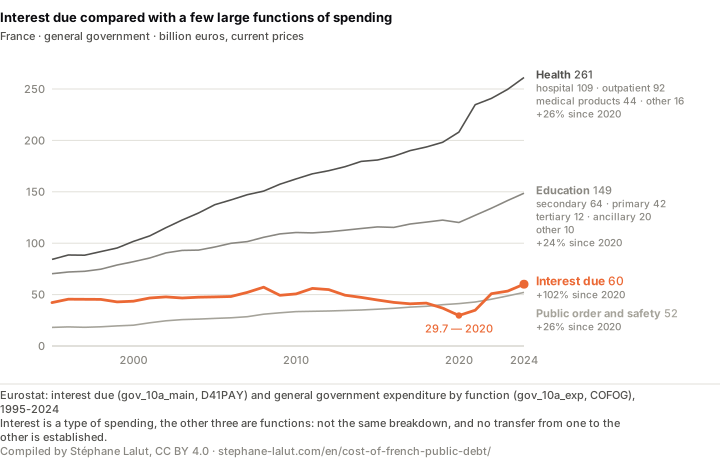
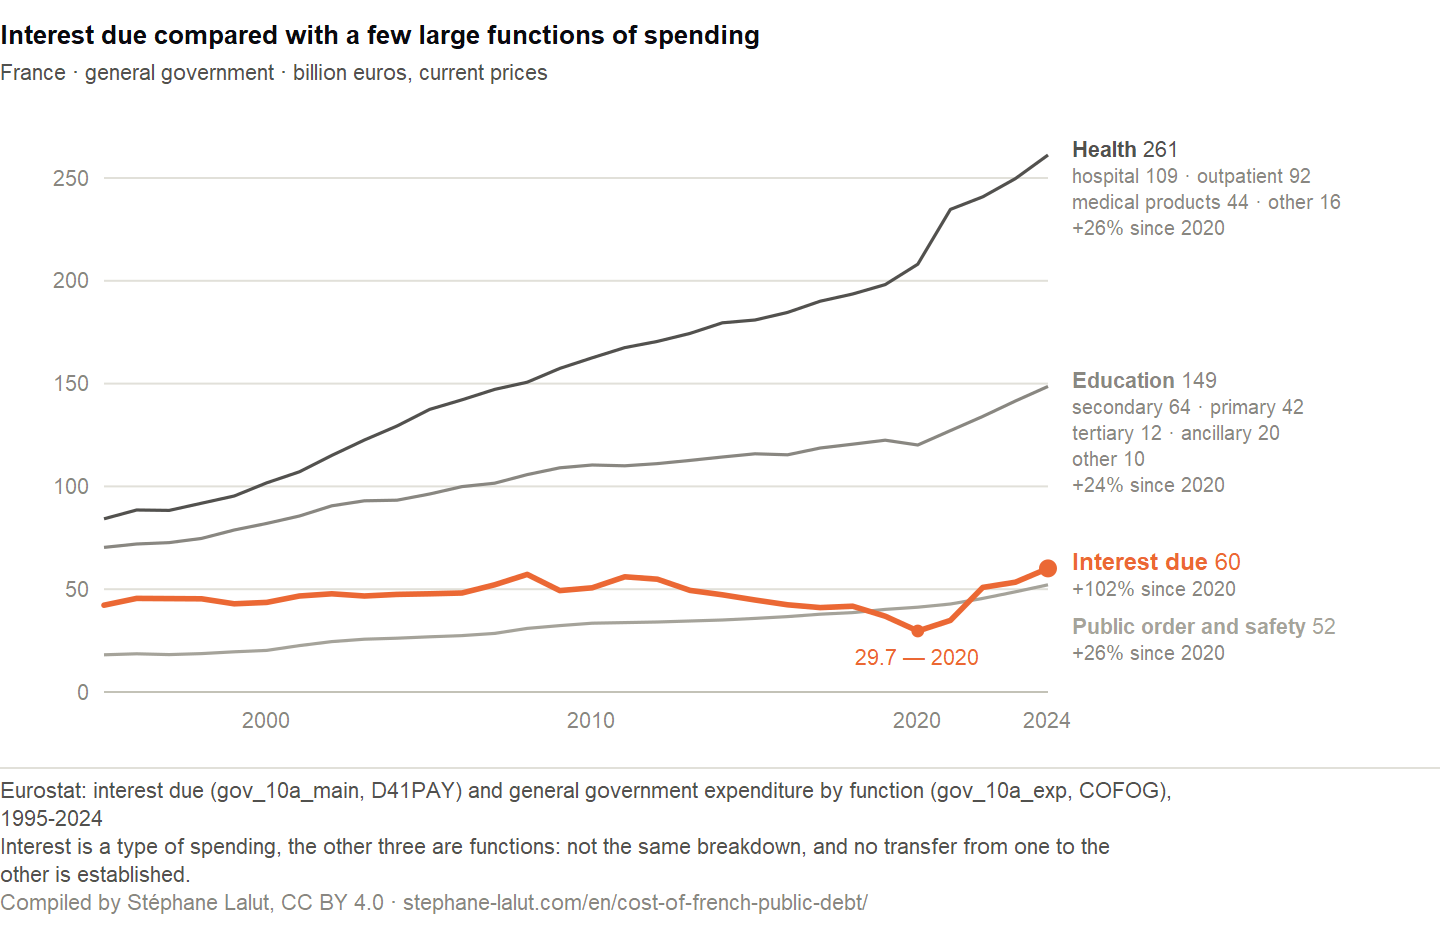
In the same year, 2024 (spending by function is published with close to a two-year lag), interest (60.1 billion euros) amounted to 4.0% of public revenue. It sits between public order and safety (GF03, 52.1 billion), which it exceeds, and education (GF09, 148.6 billion), of which it represents about 40%. It remains far below health (GF07, 261.2 billion), of which it represents about 23%. Against the law courts alone (GF0303, 8.3 billion, not the whole Justice ministry budget), the interest burden is about 7.2 times larger.
Eurostat, interest due and general government expenditure by function. Every series stops at the same vintage.
Since the 2020 trough, the burden has risen faster than each of the nine other main functions of spending: +102%, against +59% for the fastest of them (housing and community amenities). The tenth, general public services, contains interest itself. Over the whole period it was the other way round: falling rates lightened the bill while public spending rose.
Caveat: these comparisons set masses side by side, not causes — no euro of interest is deemed to have been taken from health, education or the courts
Interest is a type of spending, the items compared are functions. Not the same breakdown — interest sits inside the general public services function — and the comparison does not say that a euro of interest was taken from any of these budgets: it conveys scale, a weight relative to public resources.
What stock does this bill pay for?
This bill pays for a stock: the accumulated debt, the figure most often quoted. How it built up (what it owes to deficits, interest and growth) is the subject of the first part of the dossier, Why does public debt rise?
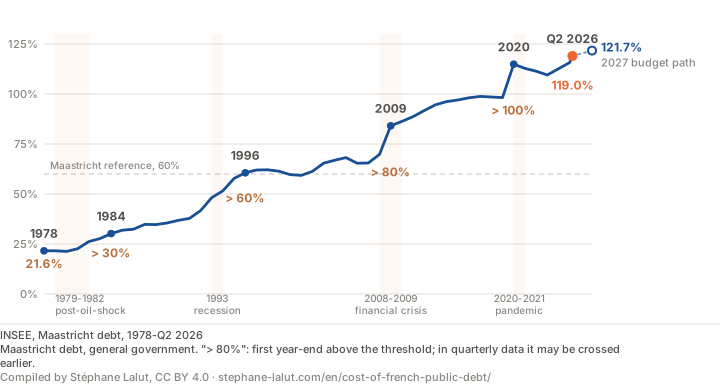
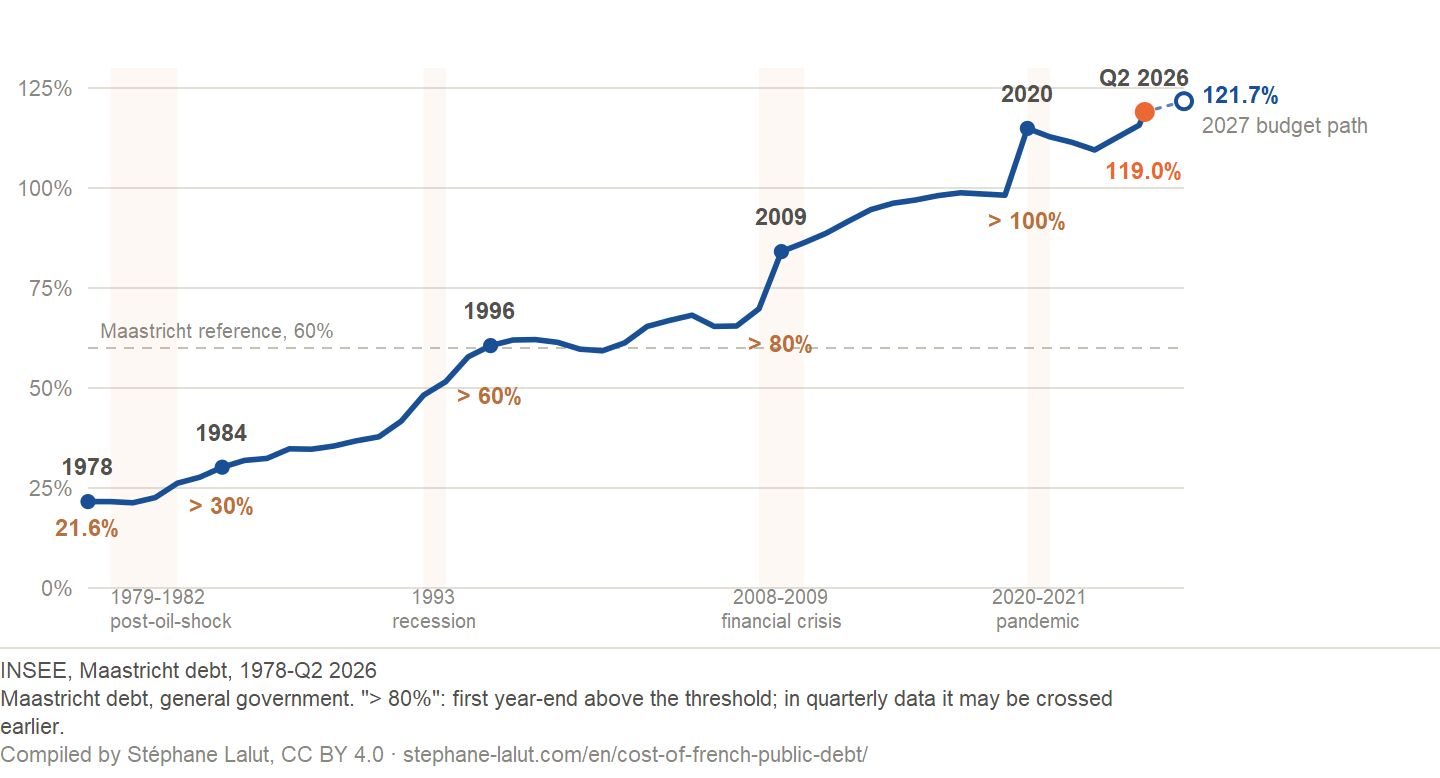
Since 1978, French public debt has gone from 21.6% to 119.0% of GDP, multiplied by 5.5. It climbs in steps: the main jumps coincide with crises, then the persistence of deficits prevents the step from being undone; in the observed series, the ratio has never returned to its level of ten years earlier. On INSEE’s quarterly series, available since 1995, the highest ratio is reached in Q2 2026 (119.0%).
The thresholds since 1978: 30, 60, 80 then 100% of GDP, crossed after the oil shocks, the 1993 recession, the financial crisis and the pandemic
1978 — 21.6%. Thirty years of strong growth and inflation had diluted the post-war debt: the State repaid in a currency that was losing its value. The lightning deleveraging usually credited to post-Liberation inflation, however, needs revising: by bringing back the black-market prices that the official index ignored, Baubeau and Teixeira show that prices rose far more during the war, and less afterwards, than was believed; relative to national income, the debt therefore swelled less during the conflict, and melted less afterwards (Economic History Review, 2026).
1984 — 30%. After the two oil shocks growth slowed while spending did not: the deficit became permanent, not through any datable decision, but because it no longer closed between two slowdowns.
1996 — 60%. The 1993 recession widened the gap; the Maastricht Treaty, signed in 1992 and in force since November 1993, had made 60% the European reference value. Debt crossed it in 1996 and fell back below it only in 2000 and 2001.
2009 — 80%. The financial crisis cut revenue and forced support plans: 19 more points of GDP between the end of 2007 and the end of 2009. The recovery that followed did not win them back.
2020 — 100%. The shutdown of the economy and income support added 17 points in a single year. Debt exceeded GDP.
Q2 2026 — 119.0%. The stock remains on an upward trend, and its average cost has been rising since its 2020 low, mostly through the 2022 jump.
Can the bill rise if the debt stops growing?
Yes, but “the debt stops growing” can mean two things. If the stock in euros stopped growing, the burden could keep rising: old securities, issued at low rates, would gradually be replaced by costlier ones. If only the debt-to-GDP ratio stabilises, a second mechanism adds to the first: with nominal GDP growth, the debt still rises in euros, and its burden with it, even at a constant implicit rate — while its weight in GDP would stay roughly stable. Stabilising the debt in euros and stabilising its weight in the economy are not the same thing. What moves the ratio (deficits, interest, growth) is the subject of the first part of the dossier, Why does public debt rise?
What the Government forecasts. According to the Government’s scenario presented to the Haut Conseil des finances publiques for the 2027 budget bill, interest would reach 79.2 billion euros in 2026, then 91 billion in 2027, or 2.9% of GDP, the 2008 level, while debt would reach 121.7% of GDP at the end of 2027, 3.0 points more than in the 2026 budget bill. The Haut Conseil, the independent fiscal council charged by law with assessing how realistic these forecasts are, considers that the burden could exceed that amount if inflation or interest rates rose further. It also notes that the burden forecast for 2026 exceeds the initial budget act by 4.5 billion euros, mainly because of inflation-linked bonds: indexation is not only a 2022 story.
These forecasts do not extend the observed curve. The Haut Conseil writes that the 2027 burden would be “more than 25 billion euros higher than in 2025”, which implies a 2025 base below Eurostat’s 66.6 billion: the two series are not reconciled. On the charts, the forecast is drawn as open circles, not joined to the curve, and no rise between observed and forecast values is computed by subtraction.
What the data does not show
Observed health and education spending has not fallen. In euros, both kept rising. As a share of GDP, both are above 2019 (health: 8.1% then 8.9% in 2024; education: 5.0% then 5.1%), slightly below their pandemic peak (9.4% in 2021 for health), when GDP contracted. Anyone claiming that debt has “already cut” those budgets is saying more than the data does. But the reverse does not follow either: these series allow neither an attribution of their path to the debt, nor a conclusion that they would not have been higher without the interest constraint. A budget that goes from 100 to 105 instead of 110 has not fallen, and has still been crowded out. No counterfactual, no causal claim — in either direction.
Rising budgets, services under strain: a plausible explanation (labour costs, Baumol's cost disease, growing needs) that these series do not demonstrate
Hence an apparent paradox: if budgets rise, why do hospitals, schools and courts seem starved? The most common explanation — plausible, but not demonstrated by the series on this page — rests on two standard mechanisms. Public services rely heavily on human labour: their costs track wages, not the productivity gains of machines (Baumol’s cost disease, a standard result in the economics of services — its magnitude varies by sector). Demand for some of them may also grow faster than GDP: ageing and costly medical progress in health, litigation in justice. If both mechanisms hold, a spending category that remains stable as a share of GDP does not guarantee a stable volume or quality of service. Establishing that the service delivered actually fell would require what this page does not measure: sectoral inflation, wages, productivity, demographics, and the volumes actually delivered.
What the data does establish is narrower: a higher interest burden raises the borrowing requirement under unchanged policies; its consequences for spending, taxes and the deficit then depend on the choices made, the economic cycle and the financing available — which is not the same as saying that every euro of interest is a euro taken from health or education. The question is therefore not “are budgets falling?” but “who will absorb the adjustment”: higher taxes, cuts to other spending, wider deficits, inflation, or future generations. That is the subject of Who really pays for public debt?
An interpretative hypothesis of the author’s, distinct from the findings. Within the framework of anthropy, which the author sets out in the working paper AWP-07 — The anthropic loop and applies to debt in AWP-03, this sequence can be read as a cost displaced in time and then returning: displacement, saturation, return. The series on this page establish the fall and then the rise of the burden and of its average cost; they do not test that reading, nor do they say that the return was inevitable or how large it will be. Comparing the cost of new issuance with the average cost of the stock, as the working paper AWP-09 proposes, measures delayed transmission; on its own, it does not distinguish this reading from an ordinary financial explanation based on the maturity of the debt. Testing it would require a prediction of its own.
Summary
What to take away
Why the bill long fell. For twenty-five years, the falling average cost of the stock offset the rising stock: the debt doubled as a share of GDP while its burden fell.
Why it is rising. Since 2020, stock and average cost have risen together: 15.1 billion of the rise come from the stock, 21.8 from the implicit rate, most of it in 2022, the year inflation also raised the cost of indexed bonds, without these series measuring indexation’s share; taking 2019 as the starting year, the stock weighs most. The level reached is not unprecedented (the 2014 level as a share of GDP); the rise, though, is fast.
Why it can go on. The average cost catches up with market rates only as securities are renewed: the bill can rise even as the debt stops growing. The 66.6 billion are not subtracted from any single budget: under unchanged policies, they raise the borrowing requirement, and choices decide the rest.
Rule: each comparison uses a single year — 2024 for the magnitudes, 2025 for the latest burden — never two years mixed
One rule governs every comparison on this page: the most recent common vintage, the same for every term. Since spending by function is published with close to a two-year lag, the compared magnitudes are for 2024, while the most recent interest figure is for 2025. Both years are stated, never mixed.
Frequently asked questions
How much does French public debt cost each year?
The most direct measure is the interest burden of general government: 66.6 billion euros in 2025, or 2.2% of GDP and 4.3% of public revenue (Eurostat, series D41PAY, interest recorded when it falls due). That is 124% more than at the 2020 trough, and 80% more than in 2019. The level is not unprecedented: as a share of GDP, the burden is back to its 2014 level, as a share of revenue to its 2013 level, and it remains below its 1995 level (3.5% of GDP). Net of the interest general government receives, it comes to 62.7 billion.
How large is France's public debt?
3,595.5 billion euros in Q2 2026, or 119.0% of GDP (INSEE, Maastricht debt of general government). Over the INSEE series available since 1995, the highest debt-to-GDP ratio is reached in Q2 2026 (119.0%).
Why is the interest burden rising so fast?
Because two terms are rising together: the amount of debt and its average cost, the implicit interest rate. From 2020 to 2025, the burden rises by 36.9 billion euros; in an accounting decomposition, 15.1 come from the larger debt stock and 21.8 from the higher implicit rate (since 2019, before the pandemic, the split reverses: 16.1 from the stock, 13.6 from the rate). The implicit rate made most of its move in 2022, the year inflation also raised the cost of the State's inflation-linked bonds (the series do not measure indexation's share); since then, the larger stock has weighed most. This decomposition does not measure the effect of market rates: the implicit-rate part mixes refinancing, the composition of the debt and indexation.
Does the interest burden exceed the justice budget?
In 2024, the most recent year for which all series are comparable, interest (60.1 billion euros) sits between public order and safety (52.1 billion, which it exceeds) and education (148.6 billion), far below health (261.2 billion). The law courts alone, in the sense of the European COFOG classification (item GF0303, not the whole Justice ministry budget), account for 8.3 billion. These comparisons convey scale: no euro of interest is deemed to have been taken from any of these items.
Has the rise in interest already cut health or education spending?
Not in the observed aggregates: in euros, public spending on health (261.2 billion euros in 2024) and education (148.6 billion) kept rising; as a share of GDP, both are above 2019, slightly below their pandemic peak, when GDP contracted. That does not mean there was no crowding out: a budget that goes from 100 to 105 instead of 110 has not fallen, and has still been crowded out. These series allow neither an attribution of their path to the debt, nor a conclusion that they would not have been higher without the interest constraint. What they do establish: a higher burden raises the borrowing requirement under unchanged policies, and its consequences for spending, taxes and the deficit then depend on the choices made; who will absorb the adjustment is the subject of the page “Who really pays for public debt?”.
Which leaves a question these figures do not settle: who ultimately bears this burden, and is part of its cost shifted onto others? That is the subject of the next page.
The figures on this page are derived automatically from INSEE and Eurostat series, re-queried every week; last retrieval that changed a value: 11 October 2026. Three sets of values are stored in the repository, each with its source and date: the 1978-1994 ratios, transcribed from an INSEE table (their junction year, 1995, is checked against the live series at every run); and, entered by hand, the Government’s forecasts and the Agence France Trésor benchmarks. Open data: dette_officielle.json, CC BY 4.0 licence.
INSEE and Eurostat series, interest on an accrual basis, implicit rate on the stock at the end of the previous year, dated values entered by hand; compilation under a CC BY 4.0 licence
Values derived automatically from official sources: quarterly Maastricht debt from INSEE (series 010777616 — stock in billions of euros — and 010777608 — % of GDP); interest due (D41PAY), interest received (D41REC) and total revenue (TR) of general government (Eurostat, gov_10a_main); expenditure by COFOG function, including the ten main functions (Eurostat, gov_10a_exp); the 10-year yield (Eurostat, irt_lt_mcby_a). The implicit rate is a year’s interest over the stock at the end of the previous year; the decomposition of the rise in the burden splits the change between stock and implicit rate using midpoint contributions. The interest burden used here is the D41PAY series, recorded on an accrual basis — attributed to the year the interest falls due, not the date of payment, which brings the indexation of inflation-linked bonds in as soon as it accrues — and covering the same universe, general government as a whole, as the revenue it is set against; INSEE’s accounts present interest before the FISIM adjustment (financial intermediation services indirectly measured) and report a slightly different amount for the same year: two closely related conventions, not two contradictory measurements.
Values entered by hand. The Government’s forecasts for 2026 and 2027 and its sensitivity to rates and inflation are read in the opinion of the Haut Conseil des finances publiques on the 2027 budget bills (paragraphs 113, 115 and 116), which reports them; the opinion is archived with its fingerprint. They are not subtracted from the Eurostat observation: the 2025 value underlying the forecasts is not reconciled with the series used here. The average maturity and the inflation-linked bonds of the State’s negotiable debt are those published by the Agence France Trésor for the end of August 2026.
The official series are re-queried every week; the retrieval date changes only when a release changes a figure. The consolidated data is published openly as dette_officielle.json under a CC BY 4.0 licence — free reuse, including commercial use, on the single condition that the source is cited. The raw series belong to INSEE and Eurostat; what is licensed here is the compilation: the assembly of series, the derived quantities (implicit rate, decomposition, ratios, single-vintage equivalences) and their reconciliation.
The charts, the data and a ready-made citation, under an open licence. Each chart carries its source, vintage and reading caveat inside the image: reused in a lecture or an article, it does not come apart from what makes it readable.
Where the rise in interest comes from: debt stock or implicit rate, 2020-2025
How much of the rise in interest comes from the larger debt stock and how much from the higher implicit rate, year by year.
Reading caveat. Accounting decomposition, debt stock / implicit rate: the implicit-rate part mixes refinancing, debt composition and indexation; on its own, it does not measure the effect of market rates.
Computed on Eurostat (gov_10a_main, D41PAY) and INSEE (debt at 31 December) series, 2020-2025
Market rate and average cost of the stock, 1996-2025
The average cost of the stock follows the 10-year rate years behind: it falls less far, and climbs back more slowly.
Reading caveat. The 10-year yield is a reference indicator, not the actual cost of issuance; the implicit rate, the average cost of the whole stock, follows market rates only as debt is renewed, and includes the indexation of inflation-linked bonds.
What the debt costs in euros rather than as a share of GDP: the trough, then the climb.
Reading caveat. Billion euros at current prices, not adjusted for inflation. Open circles: Government forecast, whose 2025 base is not reconciled with Eurostat; no change can be read between the observed and the forecast values.
Eurostat, interest due by general government (gov_10a_main, D41PAY), 1995-2025
Interest due against the main public budgets, 1995-2024
Interest due long stayed below the public order and safety function; it has moved back above it.
Reading caveat. Interest is a type of spending, the other three are functions: not the same breakdown, and no transfer from one to the other is established.
Eurostat: interest due (gov_10a_main, D41PAY) and general government expenditure by function (gov_10a_exp, COFOG), 1995-2024
Lalut, Stéphane (2026). “What does French public debt actually cost?”. INSEE and Eurostat data, retrieved 11 October 2026. https://stephane-lalut.com/en/cost-of-french-public-debt/
In three sentences
This page measures what public debt costs each year — the interest burden, 66.6 billion euros in 2025 — rather than the size of the stock. It shows why a stock twice as heavy did not double the bill, breaks down the rise since 2020 between the larger stock and the higher implicit rate (an accounting decomposition, not a measure of the effect of market rates), places the level reached in the long series and explains why the bill can keep rising even as the debt stops growing. It compares magnitudes on one scope and one vintage, without establishing that a euro of interest was taken from another budget.
The data
Consolidated series and derived quantities: implicit rate, ratios, single-vintage equivalences.
Data and charts CC BY 4.0 — free reuse, including commercial, with attribution. Text under copyright — short quotation free, full reproduction on request. The raw series belong to their producers (INSEE and Eurostat), under their own terms.
Anthropy is the hypothesis that social systems displace disorder rather than resolve it.