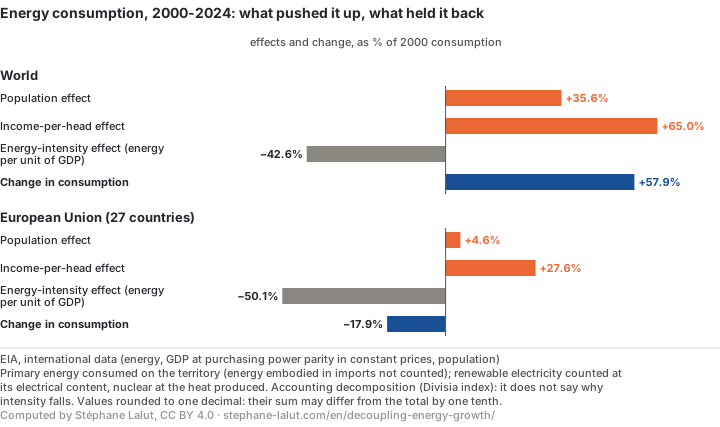
The world economy uses less and less energy for each unit of wealth it produces: 28.5% less in 2024 than in 2000. Its energy consumption, meanwhile, rose by 58% over the same period. Falling energy intensity slowed the rise; it did not reverse it.
Data as of: 26 October 2026 EIA, international data: primary energy consumption, GDP at purchasing power parity in constant prices and population, world and European Union, 1980 to 2024. Download: CSV · JSON
Intensity falls, consumption rises
From 2000 to 2024, world GDP, measured at purchasing power parity in constant prices, rose by 121%. The energy used to produce each unit of that GDP, energy intensity, fell by 28.5%. And world primary energy consumption went from 405 to 639 exajoules (one exajoule is 10¹⁸ joules): 58% more.
The world economy has therefore decoupled from energy in the relative sense: its consumption grows more slowly than its output. It has not decoupled in the absolute sense, where consumption would fall while the economy grows.
Primary energy consumed on the territory, EIA convention; effects computed with a Divisia index, which add up exactly to the change (EIA, international data).
The result in one sentence. From 2000 to 2024, world energy consumption rose by 58%: population and income per head added 407 exajoules to it, and falling energy intensity took away only 172.
Population or income?
It is often said that energy consumption rises because the world’s population rises. An accounting decomposition separates the two. Energy consumption is the product of three terms: population, income per head, and the energy used per unit of income. From 2000 to 2024, the population effect added 144 exajoules, the income-per-head effect 263, and falling intensity took away 172: 235 exajoules more in all.
Income per head therefore weighed about twice as much as demography. The ranking does not depend on the starting year: it is the same in each of the windows tested, starting in 1990, 2000, 2010, 2015 and 2019 and ending in 2024; in each, consumption rose.
The five windows, in exajoules
Start
Population effect
Income-per-head effect
Intensity effect
Change in consumption
1990
+210
+321
−248
+283
2000
+144
+263
−172
+235
2010
+89
+166
−146
+109
2015
+54
+107
−90
+71
2019
+28
+56
−46
+37
Each window ends in 2024; world, EIA. Values rounded to the exajoule: their sum may differ from the total by one.
An accounting decomposition is not an explanation. It says how much each term weighed, not why. It does not say that getting richer causes the rise in consumption, nor that falling intensity comes from more efficient uses: intensity also falls when the economy shifts towards services, or when a measurement convention counts electricity differently. Nor can it be used to estimate a rebound effect.
Why the intensity effect (−172 exajoules) exceeds the fall in intensity itself
The decomposition measures each change in logarithms, which makes the sum of the effects exact. Intensity was multiplied by 0.715 (a fall of 28.5%), whose logarithm is −0.34. That value applies to the period’s average consumption, 513 exajoules (a so-called logarithmic mean, between 405 and 639): hence an effect of −172 exajoules. Set against the 405 exajoules of 2000, it is worth 42.6%, the figure in the chart: it is the same fall in intensity, measured on a wider base, not a second fall.
The European Union: absolute decoupling, on its territory
The same producer, with the same definition, gives the other case for the EU-27. From 2000 to 2024, its primary energy consumption fell by 18%, from 66 to 54 exajoules, while its GDP rose by 43%; it peaked in 2006. The population effect adds 3 exajoules, the income-per-head effect 18, and the 42.4% fall in intensity takes away 33: more than the other two combined.
The end year matters. Stopping in 2019, before the pandemic and the 2022 surge in energy prices, European consumption falls by 6.4% from 2000, with GDP up 34%. Absolute decoupling is already there, but more than half of the fall measured to 2024 came after 2019; these data do not say how much of it will last.
What the comparison does not say. These figures count the energy consumed on European territory, not the energy used to make the goods Europe imports. They cannot tell whether the fall comes from efficiency, from the decline of the most energy-intensive industries or from their relocation outside Europe. Settling that would require an energy footprint of European demand, which we have not found published in a reusable form.
Does the result depend on the source?
Primary energy conventions differ from one producer to another. The EIA counts hydro, wind and solar electricity at its electrical content, 3,412 Btu per kilowatt-hour, and nuclear at the heat produced by the reactor, from 10,400 to 10,700 Btu per kilowatt-hour depending on the year: we find these ratios in its files every year from 1990 to 2024, with no change of convention. The Energy Institute, which publishes the Statistical Review of World Energy, counts all non-fossil electricity as the amount of fossil fuel that would have had to be burned to produce it.
With its primary energy (2025 edition) and World Bank GDP and population, the decomposition gives the same ranking: world consumption up 60% from 2000 to 2024, income-per-head effect 261 exajoules, population 141, intensity −164: 164 taken away from the 403 added. For the European Union, the fall is 12% instead of 18%: the direction does not change, the size depends on the convention.
Confronting the research
Paul Brockway and four co-authors, researchers in energy economics and engineering (universities of Leeds, Sussex, Massachusetts, SOAS and Calvin, IFP Energies nouvelles), reviewed in 2021 thirty-three studies that estimate the rebound effect for a whole economy, twenty-one based on general equilibrium models and twelve on other methods. They conclude that these effects may erode more than half of the energy savings expected from efficiency, and that global scenarios take too little account of them: this is the thesis they defend against the models that project absolute decoupling.
On the observation, our figures agree with theirs: from 1971 to 2018, they write, the world experienced no absolute decoupling, only national cases; the EIA series extends that observation to 2024. On the explanation, this page does not test them. The same authors stress that an improvement in efficiency measured at one level does not necessarily bring an improvement measured at another: an aggregate energy intensity does not measure efficiency, and no rebound rate can be derived from a decomposition like this one.
What these data do not say
A decomposition, not a cause. The three effects add up exactly to the change in consumption; they attribute no part of it to a cause.
Intensity is not efficiency. Energy per unit of GDP also falls when the make-up of the economy changes, or when the measurement convention changes.
A measurement convention. The EIA counts renewable electricity at its electrical content: its growth weighs less than in the Energy Institute’s convention. The recalculation on that other convention is given above.
Territory, not footprint. Energy embodied in imports is not counted: this is the decisive limit of the comparison with the European Union.
GDP at purchasing power parity. It depends on a base year and on revisions; the EIA’s constant prices are checked against the World Bank at each update.
A world aggregate. It adds up very different regional trajectories, which this page does not detail.
Sources
EIA (U.S. Energy Information Administration), international data, bulk file INTL.zip read by script: total energy consumption, GDP at purchasing power parity, population. Measurement convention read from the same file (hydro and nuclear electricity generation and consumption). Author’s calculations: logarithmic mean Divisia index decomposition.
Paul E. Brockway, Steve Sorrell, Gregor Semieniuk, Matthew Kuperus Heun and Victor Court, “Energy efficiency and economy-wide rebound effects: A review of the evidence and its implications”, Renewable and Sustainable Energy Reviews, vol. 141, 2021, doi:10.1016/j.rser.2021.110781, read in its open-access version.
Reusing this page
The charts, the data and a ready-made citation, under an open licence. Each chart carries its source, vintage and reading caveat inside the image: reused in a lecture or an article, it does not come apart from what makes it readable.
Energy consumption, 2000-2024: what pushed it up, what held it back
From 2000 to 2024, world energy consumption rose by 58%: population and income per head added 407 exajoules, the fall in energy intensity took away 172. In the EU, it fell by 18%.
Reading caveat. Primary energy consumed on the territory (energy embodied in imports not counted); renewable electricity counted at its electrical content, nuclear at the heat produced. Accounting decomposition (Divisia index): it does not say why intensity falls. Values rounded to one decimal: their sum may differ from the total by one tenth.
EIA, international data (energy, GDP at purchasing power parity in constant prices, population)
Lalut, Stéphane (2026). “Is the world economy decoupling from energy?”. EIA (international data) data, retrieved 26 October 2026. https://stephane-lalut.com/en/decoupling-energy-growth/
In three sentences
From 2000 to 2024, world energy consumption rose by 58% while the energy used per unit of GDP fell by 28.5%: relative, not absolute, decoupling. In an accounting decomposition, the income-per-head effect weighs about twice as much as the population effect. In the European Union, consumption fell on its territory; these data do not say whether through efficiency or relocation.
The data
For the world and the EU-27, every year since 1980: primary energy consumption, GDP at purchasing power parity in constant prices and population; decomposition of the change in consumption and its recalculation on other sources, in the JSON; the annual series are also available as CSV, one row per area and year.
Data and charts CC BY 4.0 — free reuse, including commercial, with attribution. Text under copyright — short quotation free, full reproduction on request. The raw series belong to their producers (EIA (international data)), under their own terms.