Did the French government gain €150bn from inflation? Not as revenue. The 2021–2023 inflation surprise reduced the real value of the payments promised on France's end-2020 fixed-rate marketable government debt by about €150bn in 2020 euros. That relief materialises as payments fall due, until 2066: only a fifth of it by end-2023. It does not prove an equivalent net fiscal gain.
Computed: 8 October 2026 Central-government marketable debt at 31 December 2020 (AFT, line by line); monthly HICP for France, 2020–2023 (Eurostat); forecasts published between November 2020 and February 2021. Download: CSV · JSON · method
What did inflation actually reduce?
At end-2020 the French government owed coupons and redemptions fixed in euros, line by line, until 2066. When prices rise more than expected, each of those euros buys less: the creditor receives what was promised, but what was promised is worth less.
To measure it, we compare two worlds. In the first, inflation is what the professional forecasters surveyed by the ECB expected in early 2021. In the second, it is realised inflation, month by month, up to December 2023. By end-2023 prices were 10.8% higher than in the first world, and that gap is assumed to remain thereafter. Each promised payment is converted into 2020 euros at the price level of its date, in both worlds; the difference between the two values, added up over all payments, gives the erosion.
An undiscounted sum of real-value differences, in billions of 2020 euros, not debt written off (author's calculation; AFT, Eurostat, ECB).
The result in one sentence. Relative to the inflation expected in early 2021, realised 2021–2023 inflation reduces the real value of the payments promised on France’s fixed-rate marketable government debt outstanding at end-2020 by about €150bn in 2020 euros, undiscounted, about 6.5% of 2020 GDP; depending on which forecast published in early 2021 is used, €145bn to €170bn.
Other work finds more: Pallotti et al. obtain, for French general government, an amount 2.33 times as large, with a different perimeter, valuation and inflation shock. The comparison with the research, further down, explains most of that gap, without fully reconciling it.
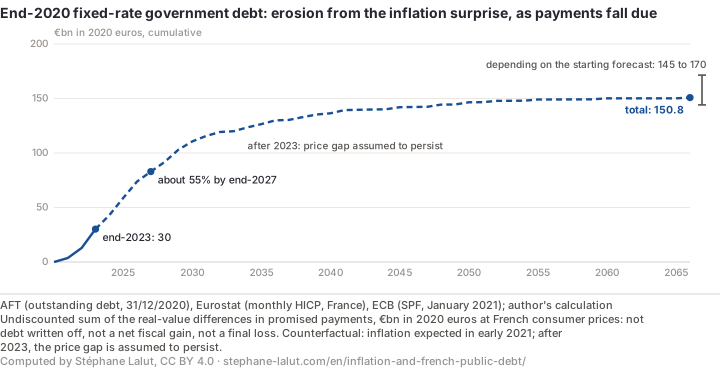
This figure does not say that the debt fell by €150bn: the amounts owed are unchanged in euros. Nor does it say that the government pocketed anything. The chart shows why. By end-2023 the price gap had built up, but only 20% of the erosion had materialised in actual payments, €30bn. About 55% will have done so by end-2027; the rest awaits distant maturities, until 2066. The shock lasted three years; its effects on legacy debt are paid out over several decades.
Amounts are in 2020 euros at French consumer prices: what these payments represent for a household spending in France. Nor is this figure the debt-ratio figure published in the debt series, which measures something else: see the section on the ratio.
Who held the claims whose real value fell?
At end-2020, France’s marketable government debt was held, at market value, 50% by non-residents, 23% by the Banque de France, 17% by insurers, 7% by banks and 3% by funds and other holders. This is a breakdown of holders, not of losses.
The direct holder is not necessarily the one who ultimately loses. Households hold almost no government bonds directly. They are exposed through their life insurance or their deposits, but that link does not allow any share of the €150bn to be attributed to them: the return paid to policyholders, the insurer’s or the bank’s own nominal liabilities, and bonds changing hands over the years all alter who ultimately bears the loss. Half of the bonds were held outside France; nearly a quarter by the central bank, whose position is examined below.
A mechanical allocation by these shares is given in the method; it does not measure who lost.
Why the government did not pocket €150bn
The first reason is on the chart: the erosion materialises as payments fall due, until 2066. Others add to it.
Because the government then borrowed at higher rates. From 2022 onwards it refinanced its maturing debt at higher rates. Part of that rise reflects revised inflation expectations, part reflects real rates and risk premia with causes of their own: the available data do not identify how much of the later rise in funding costs the episode caused. In the counterfactual used here, that rise does not undo the erosion already locked in: it applies to new financing, not to payments already promised.
Because inflation also worked elsewhere in the budget, outside this calculation. It may have swollen revenue measured in current euros, VAT for instance; it also led to the uprating of pensions and benefits, and to support measures. What is demonstrated here: the inflation surprise reduced the real value of payments already promised. What is possible: the government may have benefited through other channels, including some nominal revenue. What is not established: the total fiscal balance of the inflation surprise. The net effect on revenue is not quantified here, for lack of a comparable causal estimate: same perimeter, same unexpected shock, same period. The gross advantage measured is therefore not an identifiable net fiscal gain, which does not mean that no gain existed.
Because inflation-linked bonds worked the other way. At end-2020, 17 inflation-linked bonds, worth €220bn, escaped the erosion. Had the government issued them at a fixed rate rather than inflation-linked, the erosion would have been about €20bn larger: these bonds protected their holders.
Because the amount depends on the unit of account. Measured in units of domestic output (the GDP deflator) rather than in consumer purchasing power, the same erosion is smaller, of the order of €80bn to €92bn (details); neither unit measures a fiscal gain.
The Banque de France: why interest rates can bite sooner
The central bank changes how fast a rise in interest rates weighs on the public finances. A fixed-rate bond only becomes more expensive when it is replaced, at maturity, sometimes ten years later. Yet from 2015 to 2022 the Banque de France bought part of those bonds and paid for them with bank reserves, the money banks hold with it, whose remuneration follows current rates. For the government and its central bank taken together, a rise in rates therefore weighs on that share at once, instead of waiting for the bonds to mature.
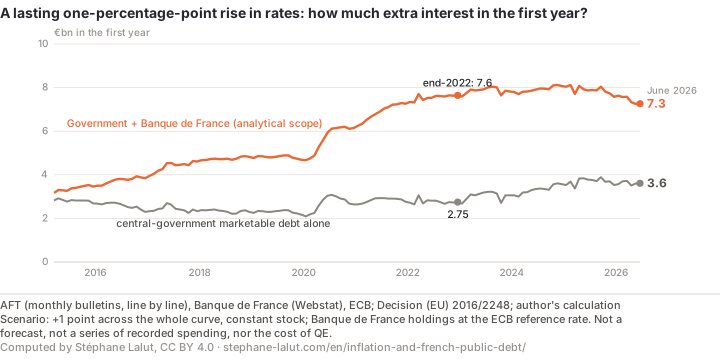
At end-2022, a lasting one-percentage-point rise across the whole yield curve would have raised the first-year interest bill by €7.6bn for the government and the Banque de France taken together (0.29 percentage points of GDP), against €2.75bn for central-government marketable debt alone: 2.8 times as much. Over five years the ratio falls to 1.3 (€12.4bn against €9.3bn): central-bank purchases mainly brought the repricing forward in time. This scenario measures an exposure, it forecasts nothing: a rise in policy rates need not shift the whole curve.
A scenario at a constant stock of debt, not a forecast; the government and the Banque de France taken together are an analytical perimeter, not interest recorded in the budget (author's calculation; AFT, Banque de France, ECB).
How. The mechanism works through two channels, which follow different rules and give different measures.
Economic channel: reserves, remunerated at the deposit rate. Because the deposit rate stayed at −0.5% until July 2022 while prices rose, reserve holders earned negative real returns, as holders of nominal fixed-rate claims did: in a simplified consolidation, the erosion is still about €149bn at end-2023. In 2024 and 2025 reserves were paid above inflation, and the consolidated erosion falls to about €114bn at end-2025: part of the advantage has already been given back, while the payments run until 2066. This is a simplified model, not a statistical consolidation: the Banque de France is outside general government, and its losses reach the government through its dividends and taxes, with a lag.
The simplified consolidation formula
consolidated erosion at date t = erosion × (1 − share held by the Banque de France) + the sum, up to t, of the real losses of reserve holders,
where one year’s real loss equals the stock of reserves at the start of the year, in 2020 euros, times the gap between the expected real return (a −0.5% deposit rate and expected inflation) and the real return obtained (deposit rate and realised inflation). Banque de France share at end-2020: 23% of the government’s marketable debt, at market value.
Accounting channel: pooled income, at the reference rate. When euro-area central banks compute the income they pool, and for that calculation only, government bonds held by the Banque de France are deemed to earn the ECB reference rate, whatever their coupon, which is unchanged (Decision (EU) 2016/2248). In the consolidated measure used here, the share held by the Banque de France is therefore treated as debt that reprices at once at the reference rate, in place of long-term fixed-rate debt. Since 2025, the reference rate has been the deposit rate.
Refixing period, the carry turning negative, and the Banque de France's accounts
The refixing period. During the purchases, the Agence France Trésor lengthened its issuance: the average maturity of its issues rose from 8.8 years in 2014 to between 10.2 and 12.5 years in each year from 2016 to 2022, and the average refixing period of fixed-rate central-government debt from 6.8 years in March 2015 to 8.5 years at end-2022. Counting, by convention, bonds held by the Banque de France as repricing immediately, the adjusted measure stayed between 6.3 and 7.1 years over the same period. Since net purchases ended, the Banque de France has held a smaller share of that debt, 17% in June 2026 against 28% at end-2022: the gap between the two lines is narrowing, without closing (2.0 times in June 2026).
The carry turns negative. According to the Banque de France’s accounts, its monetary-policy securities yielded 0.4% to 0.9% a year, while the ECB reference rate, close to zero until 2021, rose to about 4% as an annual average. On the French public-sector securities held, the gap between that yield and that rate amounted to about +€14bn cumulatively from 2016 to 2022, then −€55bn from 2023 to 2025: a balance of −€41bn over the period observed, while the Banque de France still holds part of these securities. The sharing of monetary income among euro-area central banks moves it by a few billion, to between −€44bn and −€38bn. The yield used is that of the whole monetary-policy portfolio, corporate bonds included, which probably yield more than public-sector securities: for public-sector securities alone, the balance would probably be less favourable. This is neither government budget spending nor the cost of QE: the calculation keeps market rates as they were, and no one knows what they would have been without the purchases.
What the Banque de France’s accounts show. The Banque de France, which carried out these purchases for the Eurosystem, sets its losses since 2023 against the profits it made and paid to the government before. Its accounts, which cover its whole balance sheet, bear this out: an ordinary result of €45.7bn from 2015 to 2022, of which €31.8bn paid to the government in tax and dividends, then −€30.3bn from 2023 to 2025. On the narrower perimeter of French public-sector securities alone, the carry does not balance over the period observed: −€41bn. Both findings are correct; they do not concern the same object.
Elsewhere in the euro area. The rule applies to every Eurosystem central bank. On a common basis published by the ECB, which covers all of general government and its loans, at year-end, the ratio of the consolidated first-year exposure to that of market debt ranged from 1.1 to 1.35 across countries in 2015; its peak ranges from 1.9 to 2.9 in Germany, Italy, Spain and France. For France this broader basis gives at most 2.2, against 2.8 at end-2022 in the measure focused on fixed-rate central-government debt: the two perimeters differ. Differences between countries reflect the structure of their market debt: they do not make a ranking.
These measures are not added to or subtracted from one another: no combination of them gives a net gain.
Why don't these four amounts add up?
Figure
What it measures
€149bn, then €114bn, in 2020 euros
the erosion in the simplified consolidation, at end-2023 and end-2025
€7.6bn against €2.75bn
first-year sensitivity to one more point on rates, at end-2022, in a scenario
−€41bn
the cumulative carry on French public-sector securities held, 2016–2025
−€30.3bn
the Banque de France’s ordinary result, whole balance sheet, 2023–2025
Why this is not the debt-to-GDP figure
The debt series page “Why does public debt rise?” attributes to the interest-growth effect a contribution of −16.8 percentage points of GDP to the change in the debt ratio in 2021–2023. That is not the observed fall in the ratio: it fell by only 5.4 points, mainly because primary deficits pushed it 11.5 points the other way. And the 6.5% of 2020 GDP on this page is not a 6.5-point fall in the ratio: the first figure responds to all nominal GDP growth, expected inflation included, for all of general government; the second counts only the unexpected part of inflation, on the payments already promised by the central government. Bringing them together would require a decomposition that is not made here.
What moves the number
The published range, €145bn to €170bn, comes from the starting forecast. The reference, the ECB survey, was not chosen for its level: it is the only one of the four forecasts to cover the whole horizon of payments, and the three forecasts specific to France bracket its result. Market breakevens and discounting widen it; the timing of prices explains the gap with the annual-average calculation.
Unit of account, forecasts, breakevens, discounting and the timing of prices
The unit of account. Measured in units of domestic output (the GDP deflator) rather than in consumer purchasing power, the same erosion is of the order of €80bn to €92bn. That calculation uses annual averages, on which the erosion at consumer prices is €143.2bn instead of €150.8bn when prices are followed month by month. The two units answer different questions; neither measures a fiscal gain. The gap between the two price indices is measured here, not explained.
The starting forecast. Four inflation forecasts published between November 2020 and February 2021 give: €150.8bn with the ECB Survey of Professional Forecasters (January 2021, euro area), 171.5 with the Banque de France projections (December 2020), 147.5 and 144.1 with those of the European Commission (autumn 2020, winter 2021). The Commission published no 2023 horizon: its 2022 forecast, 1.5%, is carried over to 2023, its last published horizon. Beyond 2023, all of them return to the ECB survey’s path, so only the years of the episode differ. The ECB survey is the reference because it is the only one of the four to cover the whole horizon of payments, beyond 2023 to the long term, and it fixes a single information date, January 2021, when the December 2020 price level is known; it covers the euro area, and the three forecasts specific to France bracket the result it gives.
Inflation breakevens. The yield gaps between nominal and inflation-linked bonds at 31 December 2020 (AFT) would give more: €174.8bn with the French 10-year breakeven, 157.3 with the euro-area one. They embed risk and liquidity premia, which then pulled them down: they serve only as a sensitivity here, not for the range.
Discounting. Amounts are summed undiscounted. Discounted at a real rate from −1% to +1%, they run from €130bn to €190bn across all the forecasts.
The timing of prices. The calculation follows the HICP month by month, on the date of each payment. On annual averages it gave €143.2bn: the difference mostly reflects the fact that the price-level gap that persists after the episode is the December 2023 one, larger than the gap in the 2023 average.
What these data do not tell
They do not measure the total fiscal effect of inflation (revenue, indexed benefits, support measures, nominal assets held by government), nor the debt of social security or local government. They do not say who ultimately bore the loss, nor how much of the rise in rates the episode caused. They rest on a counterfactual: another starting expectation gives another number, within the range shown. For central-bank purchases they measure an exposure and a yield gap: not the causal cost of QE, nor what rates would have been without it, nor the income the Eurosystem earns on banknotes and unremunerated reserves, nor debt sustainability.
Tested against the research literature: the order of magnitude is recovered in Pallotti et al. once conventions are aligned, but the literature does not support interpreting it as a net fiscal gain; the effect of purchases on the refixing period is close to the one the OECD published
Measured here. The real-value erosion of the payments promised on France’s end-2020 fixed-rate marketable government debt, at the pace at which the price gap actually built up, with its timing of realisation.
Consistent with. Pallotti, Paz-Pardo, Slacalek, Tristani and Violante measure a much larger gain for French general government, an estimate 2.33 times as large as ours when expressed on a common basis. The gap can be decomposed: their shock is instantaneous and measured December to December against a lower expectation, they value debt at market prices, and their perimeter covers all of general government and its inflation-linked bonds. These three factors explain about 87% of the gap; a residual of about 13% remains to be reconciled. The two calculations do not measure the same object. Hilscher, Raviv and Reis set out the method that ties the relief to the maturity of the debt; Andreolli and Rey apply it ex post to France up to mid-2022. For central-bank purchases, the OECD published France’s adjusted measure at a single point, end-2022: the effect of purchases read from its chart, 1.61 years, is close to the one we measure under its convention (1.75). The Bundesbank estimated in 2024, without publishing its method, that the adjusted refixing period could be up to two years shorter than residual maturity; for France the gap due to purchases peaks here at 2.1 years (from April to July 2022). The OBR measured the same shortening in the United Kingdom.
Challenged by. Any reading of the amount as a gain for the government. Pallotti et al. themselves subtract the episode’s fiscal costs from their gross gain: support, pensions, public purchases. And the Bundesbank noted in 2022 that, for the share bought by the central bank, the government is in effect exposed to the deposit rate rather than to the bond coupon: this is what the simplified consolidation above addresses.
Not established. The share of the later rise in rates caused by the episode, the ultimate incidence of the loss, and what rates would have been without central-bank purchases.
References read
Pallotti, F., Paz-Pardo, G., Slacalek, J., Tristani, O. and Violante, G. L. (2024), “Who Bears the Costs of Inflation? Euro Area Households and the 2021–2023 Shock”, NBER Working Paper 31896, September 2024 revision (published in the Journal of Monetary Economics, 148; journal version not read).
Hilscher, J., Raviv, A. and Reis, R. (2022), “Inflating Away the Public Debt? An Empirical Assessment”, Review of Financial Studies, 35(3), pp. 1553–1595, doi:10.1093/rfs/hhab018.
Deutsche Bundesbank (2022), “Government debt in the euro area: developments in creditor structure”, Monthly Report, July 2022, pp. 77 ff.
Andreolli, M. and Rey, H. (2024), “Fiscal Consequences of Missing an Inflation Target”, March 2024 version (NBER Working Paper 30819; IMF Economic Review, 72(2)).
Literature review checked on 8 October 2026: every reference cited was read in full on that date, in the version indicated.
Summary
What we know, and what remains undetermined
Legacy debt can lose real value without falling in euros. The unexpected 2021–2023 inflation reduced the real value of the government’s legacy nominal liabilities by about €150bn in 2020 euros: a gross advantage, measurable in the scenario used.
A gross advantage is not a net fiscal gain. It is neither €150bn of revenue nor proof of an equivalent net fiscal gain: revenue, spending and refinancing follow other mechanisms.
The date of the shock is not the date of its effects. The erosion is spread over payments until 2066, if the price gap persists.
Financial structure sets how fast interest rates feed through. A fixed-rate bond only becomes more expensive at maturity; the share the Banque de France paid for with reserves, remunerated at current rates, makes a rise in rates felt at once by the government and its central bank taken together.
What we do not know: who ultimately bore the loss, and how much of the rise in rates the episode caused.
Frequently asked questions
Did the French government gain money from the 2021–2023 inflation?
Not as revenue. The inflation surprise reduced the real value of the payments promised on France's end-2020 fixed-rate marketable government debt by about €150bn in 2020 euros (€145bn to €170bn depending on the starting forecast). It is a gross advantage, spread until 2066, not proof of a net fiscal gain: refinancing, revenue and spending follow other mechanisms.
Did savers lose what the debt lost in real value?
It cannot be quantified. At end-2020, half of France's marketable government debt was held by non-residents, nearly a quarter by the Banque de France, 17% by insurers. Households are exposed through life insurance or deposits, but the return paid, the intermediary's own liabilities and changes of holder prevent any share of the €150bn from being attributed to them.
Did the ECB's bond purchases make France more sensitive to interest rates?
Yes, mainly in the short run. The Banque de France paid for its bond purchases with bank reserves, remunerated at current rates: a rise in rates therefore weighs on that share at once, instead of waiting for the bonds to mature. At end-2022, a lasting one-percentage-point rise across the whole yield curve would have raised the first-year interest bill by €7.6bn for the government and the Banque de France together, against €2.75bn for central-government marketable debt alone; over five years the ratio falls to 1.3. It measures an exposure, neither a forecast nor the cost of QE.
Debt. Agence France Trésor, Rapport d’activité 2020, central-government marketable debt outstanding at 31 December 2020, line by line: fixed-rate OATs (face value, coupon, maturity date) and BTFs. Each coupon is paid on the anniversary of the maturity date, principal at maturity; end-2020 BTFs are spread over the twelve months of 2021.
Prices. Eurostat, monthly HICP for France (prc_hicp_midx, 2015 = 100), checked against INSEE’s figures for the 36 months of 2021–2023. The expected path starts from the December 2020 level, known in January 2021, grows each year at the expected rate and carries the seasonal pattern observed over 2017–2020; without the seasonal adjustment the result barely changes. Amounts are converted into euros of the 2020 average. The calculation in units of domestic output uses the annual GDP deflator (Eurostat), compared with two expected paths: the ECB survey’s HICP expectation and the deflator forecast by the Commission in autumn 2020.
Expectations. ECB, Survey of Professional Forecasters, first quarter of 2021 (euro area; 2024 interpolated between its 2023 and 2025 horizons, then its long-term expectation); Banque de France, December 2020 projections; European Commission, autumn 2020 and winter 2021 forecasts. Breakevens at 31 December 2020: AFT (Bloomberg data).
Inflation-linked bonds. In the counterfactual, the 17 inflation-linked bonds outstanding at end-2020 receive a fixed coupon equal to their real coupon plus the breakeven of the same index and maturity: at 31 December 2020 the AFT publishes four points (France 5 and 10 years, euro area 10 and 30 years), interpolated by residual maturity; with no short euro-area point, the French curve is shifted by the gap observed at 10 years. Result: €19.8bn, against 20.1 with the euro-area 10-year breakeven alone. Adding the gap between each bond’s index and the French HICP (€3.0bn), the ex-post cost to the government of the inflation protection embedded in those bonds reaches €22.8bn. The indexation charge recorded in the budget, which peaked at €23bn (current euros) in 2022 (€49.5bn from 2021 to 2025, AFT), is an annual flow on the whole indexed stock of each year, new issues included: it is not the same quantity as the roughly €20bn of the counterfactual on end-2020 bonds.
Holders and Banque de France shares. Three Banque de France shares appear on this page, on two perimeters and two valuations: 23% of all central-government marketable debt at end-2020, at market value (Banque de France, Webstat, holdings by sector; same source for the breakdown by holder); 28% at end-2022 and 17% in June 2026 of fixed-rate central-government debt, at face value (market-value share applied to the outstanding face value). The share of funds and other holders is rounded on the exact shares. Reserves in the simplified consolidation: proxied by the market value of the Banque de France’s holdings of government bonds at the start of each year; ECB deposit rate, annual average.
Central-bank purchases. Line-by-line schedule of central-government marketable debt at each month-end since December 2013, taken from the AFT’s monthly bulletins; the recomputed average life matches each bulletin’s to within half a day. Government bonds held by the Banque de France, all portfolios: Banque de France, Webstat, market-value share applied to the outstanding face value, below the bound given by the ECB’s government finance statistics. Average maturity of the bonds held: ECB; their breakdown by maturity is not published and is assumed to match the stock’s, which slightly overstates the consolidated exposure. Rule for pooled income: Decision (EU) 2016/2248, consolidated version at 1 January 2025 (reference rate: main refinancing operations rate, then the deposit facility rate from 2025). Yield: interest on monetary-policy securities over their average stock, and monetary-income sharing balances, from the Banque de France’s annual reports. Country comparison: ECB, government finance statistics (debt by residual maturity, debt held by the national central bank). The income the Eurosystem earns on banknotes and unremunerated reserves is left out. This calculation was subjected to external critical review, which led to rewording the result (a shift of the whole curve, dated end-2022) and to checking, in the accounts, the effect of redistribution among central banks.
Reconciliation with Pallotti et al. Done on the annual-average version of the calculation (€143.2bn): we explain about 87% of the gap with Pallotti et al.; a residual of about 13% remains to be reconciled.
Mechanical allocation of the erosion by end-2020 holdings, which does not identify the ultimate incidence
Spread according to the shares of central-government marketable debt held at end-2020 (Banque de France, market value), the €150bn erosion would give: non-residents 50%, i.e. €76bn; Banque de France 23%, €35bn; insurers 17%, €26bn; banks 7%, €10bn; funds and other holders 3%, €4bn (shares rounded on exact values: funds and other holders each account for slightly more than 1%).
This is a mechanical allocation, not a measure of who lost. Bonds change hands over the years, and the erosion, computed on flows, is spread according to shares measured at market value. The direct holder is not necessarily the one who ultimately loses: an insurer has nominal liabilities to its policyholders, a bank has deposits.
The figures on this page come from a reproducible calculation by the author, whose extract is archived with its checksums; the script that writes the page checks the main numerical statements and stops if their conditions no longer hold. Several published values are transcribed in that calculation with their source: the indexation charge recorded in the budget, the annual OAT and BTF yields and the break-even inflation rates published by the Agence France Trésor, and the inflation forecasts of the Banque de France and the Commission. Before the page was written, the calculation was subjected to external critical review, which led to revisions to the timing of prices, the construction of the range and the treatment of inflation-linked bonds.
Reusing this page
The charts, the data and a ready-made citation, under an open licence. Each chart carries its source, vintage and reading caveat inside the image: reused in a lecture or an article, it does not come apart from what makes it readable.
End-2020 fixed-rate government debt: erosion from the inflation surprise, as payments fall due
In this counterfactual the erosion is locked in by end-2023, but it materialises as payments fall due: about 55% by end-2027.
Reading caveat. Undiscounted sum of the real-value differences in promised payments, €bn in 2020 euros at French consumer prices: not debt written off, not a net fiscal gain, not a final loss. Counterfactual: inflation expected in early 2021; after 2023, the price gap is assumed to persist.
A lasting one-percentage-point rise in rates: how much extra interest in the first year?
At end-2022, had the whole yield curve risen by one point, the first-year interest bill of the government and the Banque de France together would have risen 2.8 times as much as that of market debt alone; the gap has narrowed since, without closing.
Reading caveat. Scenario: +1 point across the whole curve, constant stock; Banque de France holdings at the ECB reference rate. Not a forecast, not a series of recorded spending, nor the cost of QE.
AFT (monthly bulletins, line by line), Banque de France (Webstat), ECB; Decision (EU) 2016/2248; author's calculation
Lalut, Stéphane (2026). “Did inflation really ease France's debt burden?”. AFT, Eurostat, ECB, Banque de France, European Commission data, retrieved 8 October 2026. https://stephane-lalut.com/en/inflation-and-french-public-debt/
In three sentences
In this page’s counterfactual, relative to the inflation expected in early 2021, realised 2021–2023 inflation reduces the real value of the payments promised on France’s end-2020 fixed-rate marketable government debt by about €150bn in 2020 euros (€145bn to €170bn depending on the forecast used); about 55% materialises by end-2027. It is a gross advantage for the government, not proof of an equivalent net fiscal gain.
The data
Cumulative real-value erosion by year of payment, results for each forecast and each breakeven, inflation-linked bonds, simplified consolidation, mechanical allocation by holder and, for the central bank's purchases, the monthly exposure, the refixing period and the yield gap by year; the same content is available as CSV, in long format.
Data and charts CC BY 4.0 — free reuse, including commercial, with attribution. Text under copyright — short quotation free, full reproduction on request. The raw series belong to their producers (AFT, Eurostat, ECB, Banque de France, European Commission), under their own terms.
Revisions
— Correction: the gap due to central bank purchases peaks from April to July 2022, four months tied at the displayed precision, not in May 2022.