Are local authorities the adjustment variable of public finances?
Local authorities' debt does not settle the question: the balanced-budget rule forbids them to borrow to offset a lasting fall in the revenue that pays for their day-to-day spending, so a constraint coming from central government shows up in their revenue and spending. From 2013 to 2017, local government improved its balance by €9.7 billion. Its total spending remained almost flat in current euros, while tax revenue rose and transfers received fell. Relative to GDP, its spending fell by 0.82 points, of which 0.50 points for investment. These movements are concomitant; on their own, they do not allow the fall in investment to be attributed to the grant cuts.
Draft budget bill for 2027: what it asks of local authorities, measure by measure, and what the sum of its amounts does not say → last section of the page.
How can a constraint fail to show up in the debt? The question in the title amounts to asking whether central government, when it tightens its finances, passes part of the effort on to local authorities, and where that would show. Three paradoxes structure this page. Local debt has stayed contained, from 7.2% of GDP in 2000 to 9.3% in 2025: on its own, this observation does not say whether local authorities bore a constraint. From 2013 to 2017, their spending was almost flat in euros and fell markedly as a share of GDP: two correct readings that do not tell the same story. In Spain, central government holds more than half of subnational debt: carrying a debt and financing it are two distinct realities.
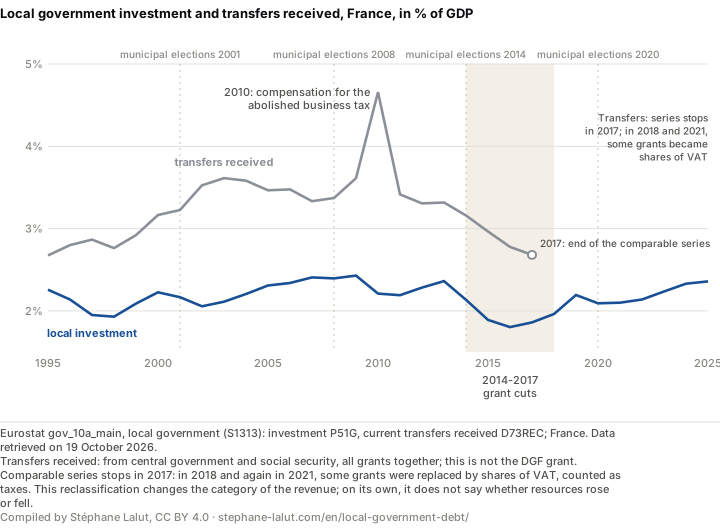
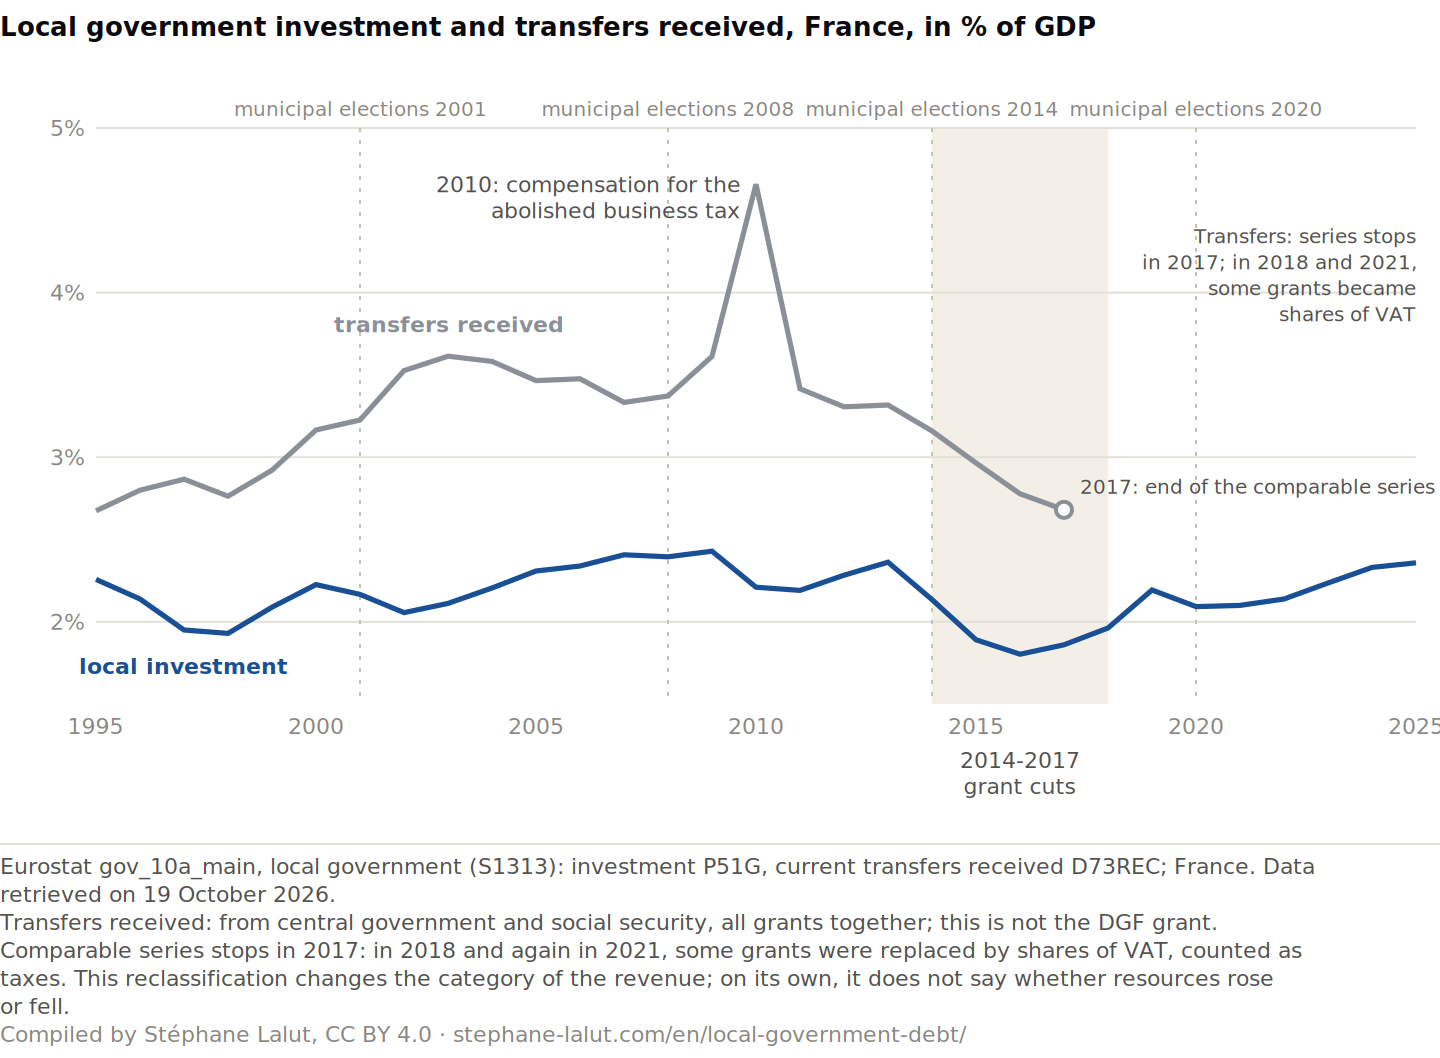
Investment by local government (gross fixed capital formation) and current transfers it receives from other general government units, in % of GDP. These transfers include those from social security: they are not just central government grants. The 2010 peak is a one-off: that year the State compensated for the abolition of the business tax (taxe professionnelle), a reform “neutral for the balance of local government” according to Insee (May 2011, our translation). The comparable transfer series stops in 2017: in 2018 and again in 2021, some grants were replaced by shares of VAT, counted as taxes, a reclassification that does not, on its own, say whether resources rose or fell (details).
The finding in one sentence. From 2013 to 2017, the transfers received by local government fell by €8.9 billion (0.64 points of GDP) and its investment by €7.5 billion (0.50 points); after the 2014 municipal elections, the fall in investment was 2.8 times as large as the largest of the falls that followed those of 2001, 2008 and 2020.
These figures, like all the statistical results on this page, concern local government in the national-accounts sense: local authorities, but also inter-municipal syndicates and other local public bodies.
Exact scope, and the bridge between local government accounts and national accounts
This scope is subsector S1313 of the national accounts; it includes other local government bodies, among them Île-de-France Mobilités and the Société des grands projets (Insee). Its debt (€279 billion in 2025) exceeds by about €60 billion the sum of the debt outstanding of municipalities, inter-municipal groupings, departments and regions.
This page draws on two sources that do not speak the same language. Eurostat publishes the national accounts, harmonised across Europe; the Observatory of local public finance and management (Observatoire des finances et de la gestion publique locales, OFGL) publishes aggregates from the local government accounting records (comptes de gestion), the ones finance departments read. The quantities correspond without being identical.
What a finance department reads (OFGL)
What Eurostat publishes
What separates them
General operating grant (DGF), central government financial support
Current transfers received from other general government units (D73)
Eurostat includes transfers from social security; a grant replaced by a share of VAT moves into taxes.
Capital expenditure
Gross fixed capital formation (P51G)
Investment grants paid out are capital transfers, outside P51G.
Net lending or borrowing
Net lending (+) or net borrowing (−) (B9)
Same concept; recording dates and scopes differ.
Gross savings
Gross saving (B8G)
Similar concepts, different adjustments.
Debt outstanding
Debt under the Maastricht definition
Nominal value; for local government, consolidated within the subsector, not between subsectors.
The sum of the debt outstanding of the four categories tracked by the OFGL (€218.5 billion in 2025) falls short of local government debt under the Maastricht definition: the latter also includes syndicates and other local government bodies, and follows other conventions. Nor is it consolidated with the State: the share the State holds (0.1 points of GDP) remains counted in it, which distinguishes it from the “contribution” of local government to consolidated public debt published by Insee. The gap can be documented; it cannot be corrected.
Two narratives, one series
The Association of French Mayors (Association des maires de France), responding to the Court of Audit (Cour des comptes) in June 2025: “Treating local authorities as the adjustment variable for the executive’s strategic errors only deepens the public deficit” (our translation). The Court of Audit (September 2025), “without ruling on the appropriateness of its amount”, calls for “organising, over time, local authorities’ participation in the recovery of public finances” (our translation).
The same series lends support to each reading. Local government spending rose from 9.9% of GDP in 1995 to 11.8% in 2009 and 2013: that is the argument for local authorities sharing in the effort. It had come back down to 10.9% in 2017, at the end of the grant cuts, and stands at 11.2% in 2025: that is the argument of authorities already called upon to contribute. Neither reading suffices on its own; the useful question is when, through which channel and in which unit a constraint can be seen.
Why the debt is not enough to answer
The observation holds. Local government debt went from 7.2% of GDP in 2000 to 9.3% in 2025, while public debt went from 59.7% to 115.7%, and it amounts to less than a tenth of public debt (8% in 2025). Yet local government carries out 54% of public investment (2.4% of GDP in 2025). The figure of 115.7% comes from Eurostat’s quarterly series (updated on 21 July 2026); the notification of 22 April 2026, which the other pages of the dossier cite, gave 115.6%.
The reason lies in a rule. The General Code of Local Authorities (CGCT) requires a genuinely balanced budget: operating and investment sections each voted in balance, and loan principal repaid out of own resources, excluding the proceeds of borrowing (article L. 1612-4). Borrowing remains open to finance investment: the rule does not freeze the stock of debt, which in fact rose in 2020 and since 2023. What it does prevent is shifting a lasting fall in operating resources onto borrowing; such a fall then goes through own revenue, current spending, gross savings or investment. Nor does the rule govern the whole subsector, which includes bodies other than local authorities.
Contained debt is consistent with an adjustment through resources and spending, and with the absence of one: it does not measure how intense a constraint has been. No single indicator replaces it here. The accounts make it possible to observe mechanisms and episodes; they do not make it possible to turn them into a general rule since 2000, nor to attribute those episodes to a cause.
2013-2017: the grant cuts, in euros and in points of GDP
Over these four years, the State cut its general operating grant (dotation globale de fonctionnement, DGF) under the heading of the “contribution to the recovery of public finances”. Three quantities describe the episode, and none replaces the others:
Quantity
What it measures
From 2013 to 2017
DGF set by the budget act (article L. 1613-1 of the CGCT)
the amount of the grant set each year
from €41.5 billion to €30.9 billion
Transfers received (Eurostat, D73)
current transfers from central government and social security, all grants included
down €8.9 billion, or 0.64 points of GDP
Investment (Eurostat, P51G)
local government gross fixed capital formation
down €7.5 billion, or 0.50 points of GDP
In 2017, the annual level of the voted DGF was €10.6 billion lower than in 2013. This is not the total of the savings accumulated over the four years, which would add up each year’s shortfall relative to 2013.
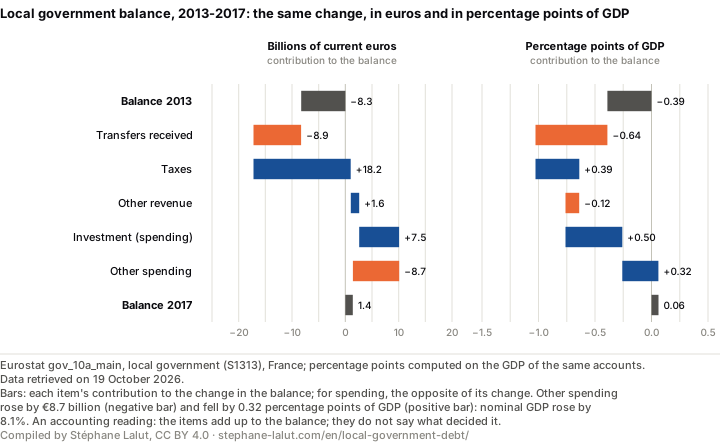
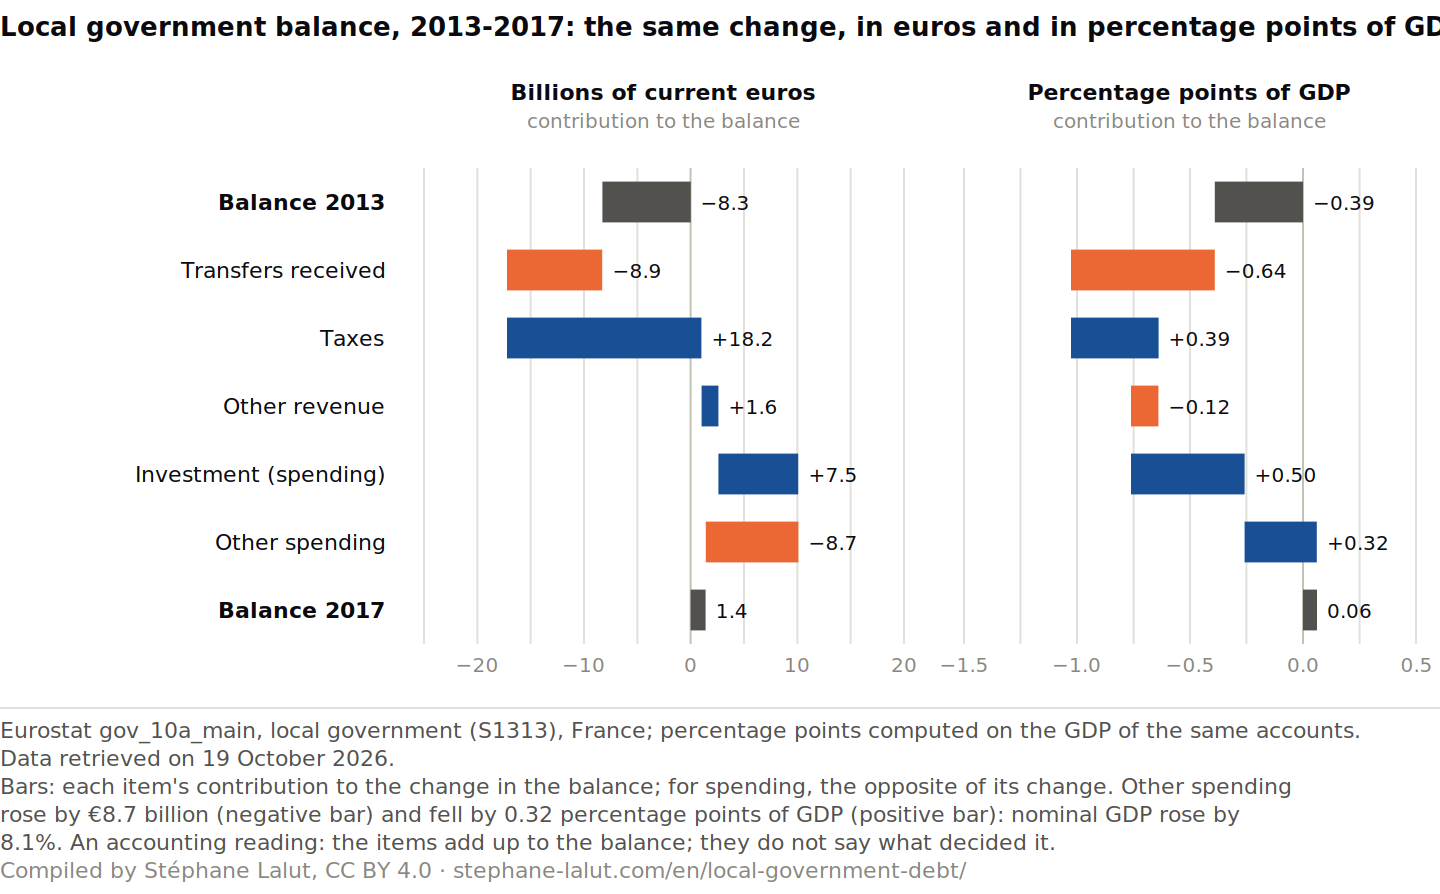
Change in the local government balance between 2013 and 2017, broken down into five items, in billions of current euros (left) and in points of GDP (right). Each value is the item’s contribution to the change in the balance: for spending, the opposite of its change, so that lower spending improves the balance. Nominal GDP grew by 8.1% over the period: this denominator is what separates the two readings.
Both readings are correct, and they do not tell the same story. In current euros, revenue rose by €10.9 billion, taxes alone by €18.2 billion, while transfers received fell by €8.9 billion; total spending went from €249.6 billion to €250.8 billion. The balance thus improved by €9.7 billion (0.45 points of GDP), on the revenue side. In points of GDP, spending fell by 0.82 points, of which 0.50 points for investment, and taxes offset only part of the fall in transfers (0.39 points against 0.64 points).
The difference lies in the denominator. Nominal GDP grew by 8.1% between 2013 and 2017: spending held almost flat in euros falls as a share of GDP. A fall in a ratio does not prove a fall in spending in euros. Investment, for its part, also fell in euros, by 15%, while other spending rose by €8.7 billion. No reading in volume, which would require a price index specific to local spending, is made here.
These movements are concomitant; on their own, they do not allow the fall in investment to be attributed to the grant cuts.
The comparison does not allow the size of the trough to be put down to the municipal cycle alone. Local investment usually falls after municipal elections. But after the 2001, 2008 and 2020 elections, the fall never exceeded 0.20 points of GDP; after those of 2014, it reached 0.56 points in 2016, 2.8 times as much, while central government grants were falling. The comparison weakens the explanation by the electoral calendar alone; it does not isolate the effect of the grants, all the more so since departments and regions, included in the aggregate, do not follow this cycle. The page Is public debt a burden on future generations? places this trough within the decline in net investment by general government as a whole: from 2006-2015 to 2016-2025, local government accounts for 56% of it.
The electoral-cycle check, term by term, the three measures of the DGF and the accounting check on the waterfall
Municipal elections
Year before, % of GDP
Lowest of the election year and the next two
Change, points of GDP
2001
2000: 2.23
2002: 2.06
−0.17
2008
2007: 2.41
2010: 2.21
−0.20
2014
2013: 2.36
2016: 1.80
−0.56
2020
2019: 2.19
2020: 2.09
−0.10
Insee attributes the 2014 fall to its coming “in the wake of the municipal elections”, then that of 2015 “notably” to the municipal electoral cycle, noting that year the effect of “the cut in State transfers” (our translations).
The four episodes are not identical: 2008 came just before the financial crisis, 2020 was the year of the pandemic. Isolating the effect of the grants would require comparing, authority by authority, those most and least exposed to the cuts, before and after 2014.
The voted DGF fell every year, by €1.4 billion in 2014, then by €3.5 billion, €3.4 billion and €2.4 billion in the following three years. The amount of the DGF set by the budget act is neither the contribution demanded of each category nor the DGF each authority actually recorded in its accounts: these three measures do not add up. The local government accounts show the third measure by category: the departments’ DGF fell from €12.2 billion to €8.7 billion, that of the regions from €5.5 billion to €4.1 billion.
The waterfall is checked by an identity the generator verifies on every run: total revenue minus total spending equals the balance published by Eurostat. Over the 31 years available, the largest gap is €0.1 million, a rounding difference. Each of the two waterfalls adds up to the change in the balance. The denominator’s share is computed exactly, on the GDP of the same accounts: with spending unchanged, GDP growth would have lowered the ratio of spending to GDP by 0.87 points; the rise in spending in euros took back 0.05 points, hence the fall of 0.82 points.
The mechanism changes, the question remains
A constraint from central government can reach local authorities through channels that are not of the same kind: some reduce resources, others cap spending, others again change the make-up of revenue. Since 2014, they have followed one another.
2013-2017: acting on resources. The voted DGF fell every year; investment fell over the same period.
2018-2019: regulating spending. The Cahors contracts set certain local authorities a target for the growth of their operating expenditure, based on a national benchmark of 1.2% a year. The financial clawback provided for in case of overshooting was suspended for 2020 expenditure. A new channel of constraint emerges, without implying that the earlier ones disappeared; this page cannot measure its specific effect.
2018 and 2021: changing the make-up of revenue. A grant (2018), then abolished taxes (2021), gave way to shares of VAT or to a levy on State revenue. Some resources are replaced by revenue of a different kind: their accounting classification changes, but this reclassification does not, on its own, allow us to conclude that the resources available have risen or fallen. The series then stop being comparable (details below).
2027: several channels at once. A levy on resources, a grant tied to investment, the timetable of repayments: the draft budget bill combines them (last section).
The Cahors contracts in the text: authorities covered, base, financial clawback
The public finance programming act of 22 January 2018 set local authorities a national target for the growth of their real operating expenditure of 1.2% a year, in value, computed on a 2017 base (article 13). Contracts, known as the “Cahors contracts”, applied it for the years 2018, 2019 and 2020; they covered the regions, the departments and the authorities with special status, as well as the municipalities and inter-municipal groupings whose real operating expenditure exceeded €60 million in 2016 (article 29). For a signatory authority, overshooting triggered a financial clawback of 75% of the gap, capped at 2% of real operating revenue (article 29, V); a different rate applied to authorities that did not sign (article 29, VI).
The emergency act of 23 March 2020 set this clawback aside for 2020 expenditure (article 12): it could therefore only apply to 2018 and 2019 expenditure. The effect of the contracts cannot be measured in these series: they bore only on the main budget of the authorities concerned, which the national aggregate does not separate out.
Two other channels escape these series: responsibilities transferred without full funding, whose fixed compensation falls behind the actual cost and is read responsibility by responsibility (the departments’ individual solidarity allowances, for example), and unfunded standards, whose cost is read in impact assessments. All these channels share a hypothesis to test: a decision taken at one level can shift part of its cost onto another. Working paper AWP-09 confronts it with the 2013-2017 episode: the accounts make it compatible, without establishing it.
2018 and 2021: when a resource changes classification
In 2018, the regions’ DGF went from €4.1 billion to €0.3 billion while they received €4.2 billion of VAT (OFGL): a revenue item classified among transfers became a tax revenue. In 2021, transfers received by local government as a whole dropped by 0.66 points of GDP and its taxes rose by 0.44 points: the abolition of the residence tax on main homes (taxe d’habitation) and that of the regional share of the business value-added tax (CVAE) were offset by shares of VAT or, for municipalities, by the departmental share of property tax. A series limited to grants alone therefore does not, on its own, measure how resources have changed.
The 2021 offsets, text by text
The abolition of the residence tax on main homes was offset by a share of VAT for inter-municipal groupings and departments, municipalities receiving the departmental share of property tax (budget act for 2020, article 16); the abolition of the regional share of the CVAE, by a share of VAT for the regions (budget act for 2021, article 8); the reduction in the rental values of industrial premises, by a levy on State revenue (same act, article 29).
By category of authority: what the aggregate hides
The national aggregate adds up authorities whose revenue and costs have nothing in common. Since 2018, the Observatory of local public finance and management (OFGL) has published the consolidated accounts of each category, the ones finance departments read. Two movements appear there that are invisible in the aggregate. Departments’ gross savings, that is their operating revenue minus their operating spending, fell from €13.2 billion in 2022 to €5.7 billion in 2024, before rising back to €8.0 billion in 2025; the causes (property transfer duties, solidarity allowances) lie in series this page does not carry. Municipalities’ capital expenditure went from €20.0 billion in 2020 to €30.1 billion in 2025 (+51%), in the run-up to the 2026 municipal elections.
The four categories of local authority, 2021 to 2025: central government grants, gross savings, capital expenditure, debt
Category, 2021 → 2025
Central government grants
Gross savings
Capital expenditure
Debt outstanding
Municipalities
14.9 → 16.6
14.1 → 15.3
21.1 → 30.1
70.6 → 73.9
Inter-municipal groupings
9.6 → 10.0
9.9 → 11.6
12.4 → 17.7
48.8 → 56.5
Departments
10.8 → 10.5
12.4 → 8.0
9.2 → 9.2
42.7 → 48.9
Regions
2.2 → 1.8
5.8 → 6.3
3.9 → 3.7
33.0 → 39.2
Billions of euros, current prices. Source: OFGL, consolidated databases of the local government accounts (DGFiP).
The boundaries of the categories change with reforms: the departments’ consolidated database used here includes the Lyon metropolis (since 2015) and the City of Paris (since 2019), and that of the regions the single authorities of French Guiana, Martinique and Corsica — the OFGL annual report, for its part, classifies Lyon with inter-municipal groupings and Paris with municipalities. National accounts and local government accounts do not match to the million: scopes, recording dates and adjustments differ.
Since 2023: local government debt is rising again
Since 2023, local government net borrowing has been well above its 2021 and 2022 level (less than a tenth of a point of GDP): 0.35 points in 2023, 0.61 points in 2024 and 0.52 points in 2025. Its investment has risen from 2.2% to 2.4% of GDP, and its debt from 8.9% to 9.3% of GDP: the reverse of the 2013-2017 pattern. In the accounts of the four categories of local authority, debt outstanding is rising too: €200.5 billion in 2023, €218.5 billion in 2025. The rest of the increase cannot be attributed by subtraction to syndicates and other bodies: the two sources do not consolidate in the same way and do not follow the same conventions.
The tax revenue smoothing mechanism (DILICO), in 2025 and 2026
The cyclical smoothing mechanism for tax revenue (dispositif de lissage conjoncturel des recettes fiscales, DILICO) took €1 billion from local authorities’ tax resources in 2025, placed in reserve and paid back in thirds over the following three years — 90% to the contributing authorities, 10% to equalisation funds (budget act for 2025, article 186); it was renewed in 2026 (budget act for 2026). Neither Insee nor Eurostat documents how it is recorded in the national accounts: its own effect cannot be isolated in these series.
Elsewhere in Europe: the same debt, opposite architectures
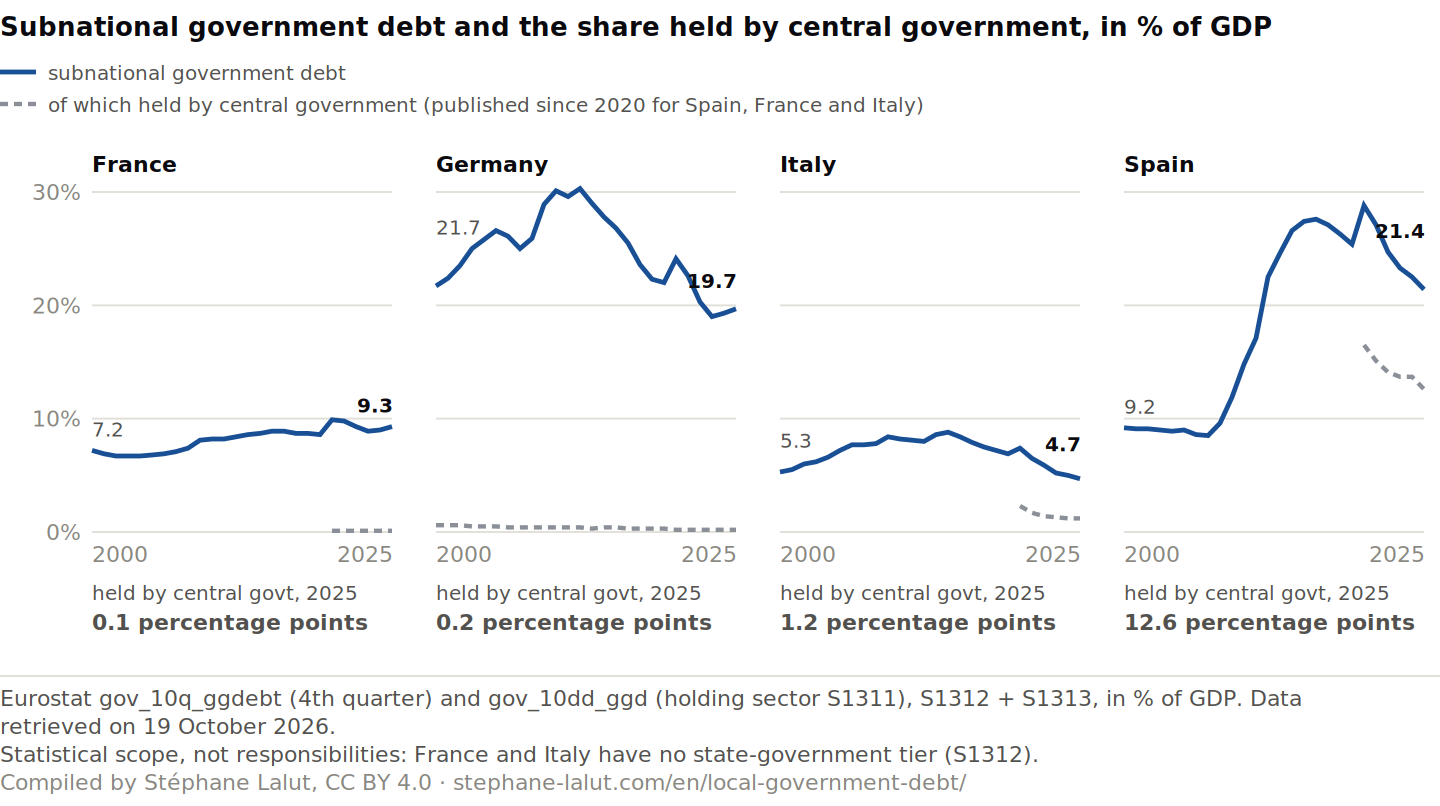
Comparisons here are made by statistical scope, not by responsibilities exercised. France and Italy, where regions are classified in local government, form the main comparison; Germany and Spain, whose subnational debt adds that of the Länder or autonomous communities to that of local authorities, serve as counterpoints.
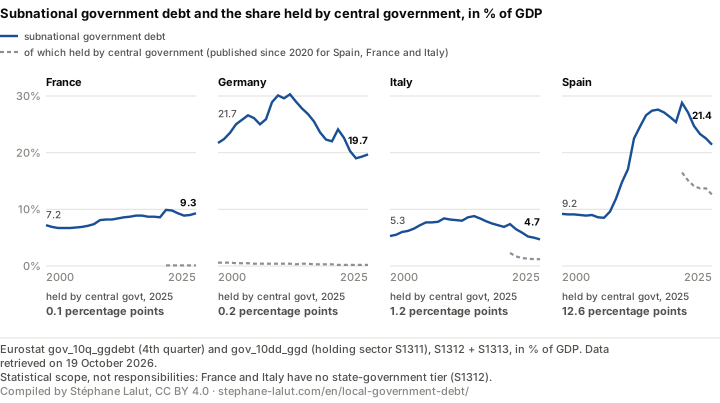
Subnational government debt (state and local government, S1312 + S1313) in % of GDP, fourth quarter of each year, and the share held by central government, published since 2020 (shown under each country).
In Spain, subnational debt went from 9.2% of GDP in 2000 to 21.4% in 2025, driven by the autonomous communities, while subnational investment fell by 64%. But this debt does not measure a constraint passed downwards: in 2025, 12.6 points of GDP out of 21.4, or 59%, were held by the central State itself, notably through the Fondo de Liquidez Autonómico, created in 2012, through which the State lends to the autonomous communities (Real Decreto-ley 21/2012, articles 9 and 14). The equivalent share is 26% in Italy, 1% in France and 1% in Germany. Who carries a debt and who finances it are two distinct questions.
In Italy, the three indicators point the same way: subnational debt fell back from 8.8% of GDP in 2014 to 4.7% in 2025, the balance was in surplus in eight years out of eight between 2012 and 2019 (France: three), and investment fell to half its peak of the 2000s. These concomitant movements do not separate the effect of national rules — the internal stability pact, introduced in 1999 and abandoned for local authorities in 2016 — from that of the sovereign debt crisis.
In Germany, subnational debt remains well below its 2012 peak (30.3%, 19.7% in 2025), with a limited fall in investment (16%); it is carried mainly by the Länder.
The comparison yields no single ranking: debt, balance and investment order the four countries differently. It shows that a public finance constraint can travel between levels of government in opposite forms — a cut in grants, a fall in investment, debt, or the financing of the subnational tier by the centre.
In % of GDP. Subnational scope: S1312 + S1313 (cross-holdings between the two tiers at most 0.2 points). Source: Eurostat.
The state government subsector (S1312) exists in the Eurostat data only in a few countries, including Germany and Spain; French and Italian regions are classified in local government (S1313). In Germany and Spain, subnational debt therefore adds the two tiers together; cross-holdings between them amount to at most 0.2 points of GDP: the double counting is marginal and does not change the orders of magnitude. In Spain, Organic Law 2/2012 also assigns the surpluses of each level of government to reducing its net debt (article 32).
What does the draft budget bill ask of local authorities?
State of the text: draft budget bill for 2027 (projet de loi de finances), tabled on 1 October 2026, before examination by Parliament; its amounts may change before the act is passed.
Measure in the 2027 draft budget bill
Text
Nature
Amount, €bn
Progressive contribution to the budgetary effort, levied on tax advances
article 37
levy on tax advances, introduced for 2027
2.5
VAT compensation fund: rate cut by 5 percentage points, except green spending and roads
articles 35 and 41
cut in a central government grant tied to eligible investment spending
2.1
Assigned VAT, excluding regions: annual increase reduced by inflation
article 36
capping of the growth of assigned VAT, excluding regions
0.6
Contributions of certain ministries to local authorities
appropriations under State budget missions
cut in contributions from certain ministries
0.7
Sums placed in reserve in 2025 and 2026 (DILICO): repaid over five years instead of three
article 84
repayment spread out; total amount returned unchanged
0.3
Amounts for 2027, as provided for in the bill as tabled, before examination by Parliament. Sources: draft budget bill (explanatory memoranda) for the first two rows; opinion of the High Council of Public Finance for the next three, which the text of the bill does not quantify.
The bill does not cut the DGF: it provides for €150 million of new increases and, taking scope changes into account, its nominal amount rises by €137 million, to €27.5 billion. The contribution required from local authorities goes through the five channels in the table and, for the regions, through the removal of a share of excise duties on energy worth €157 million (article 39). The High Council of Public Finance (Haut Conseil des finances publiques) groups these measures in a single package moderating local authority revenue.
How could local authorities’ resources rise by €5 billion when the arithmetic sum of the bill’s measures comes to €6.2 billion?
Reading
Figure
What it is
Measures listed
€6.2 billion
arithmetic sum of five heterogeneous amounts (the table above), not a proven net levy
Projected change in resources
+€5 billion (+1.7%)
Government projection between 2026 and 2027, after the measures
Net effect of the five measures
not established
adding them up does not establish it
Why do these figures coexist? The arithmetic sum of €6.2 billion brings together five measures, each assessed against the situation without it, on different baselines; the Government’s €5 billion compares two years, measures included. Their difference, €1.2 billion, is therefore not a net levy, and adding up the five measures is not enough to establish their net effect: a resource can rise in euros while growing more slowly than it would have without the reform. Nor are the five measures of the same kind, and two of them bear on related flows: their exact reconciliation is not made here.
Nature of the five measures, base of the progressive contribution and levies on State revenue
Spreading out the repayment of the sums placed in reserve (DILICO) shifts a timetable without changing the total amount returned (article 84); the cut in the rate of the VAT compensation fund depends on the investment local authorities will carry out. The text describes no double counting between these amounts, but two of them bear on related flows: the progressive contribution is charged to the monthly tax advances and to the shares of VAT, whose growth is also being capped (articles 36 and 37).
The progressive contribution applies to 40% of municipalities, to 60% of departments and to the inter-municipal groupings of metropolitan France, at a rate that rises with their resources, applied to real operating revenue of the year before last; overseas authorities and the most socially fragile departments are exempt (article 37). In the State budget, the levies on State revenue in favour of local authorities (prélèvements sur recettes) are estimated at €43.1 billion for 2027, against €44.46 billion in the revised forecast for 2026 (€44.82 billion in the initial budget act, article 41): a series limited to grants would not see these channels, for the reason already encountered in 2018 and 2021.
The High Council forecasts a fall in local authorities’ investment of 4.2% in 2027, after 4.0% in 2026, and considers it plausible given the position of 2027 in the municipal electoral cycle, one year after the elections, and given the reform of the compensation fund. This page measures what a fall in investment amounted to from 2013 to 2017; it does not say whether it will happen again. Texts: draft budget bill for 2027 (in French), articles 34 to 41 and 84; opinion of the High Council of Public Finance (in French).
What the accounts allow us to say
Three perspectives must be kept apart. What is decided: grants, transferred taxes, spending rules and financing arrangements, set by budget and programming acts. What is observed: revenue, spending, investment, savings, balance and debt, in the national accounts and the local government accounts. What is ultimately borne: the effects on taxpayers, users, services and facilities, which these data do not measure.
This page documents decisions and concomitant accounting movements; it does not demonstrate the transmission from the former to the latter and does not measure what is ultimately borne.
The analytical scheme: a four-link chain
Between what is decided and what is borne, a four-link chain describes the possible mechanisms. It is an analytical scheme, not a causality demonstrated at each link:
national decision: grant cut, revenue capped, spending rule;
local constraint: fewer resources, or less freedom to choose;
local budgetary response: taxation, operating spending, savings, investment, borrowing;
final incidence: services, facilities, taxpayers, users, places.
Decisions belong to the first link, accounting movements to the third; the fourth is not measured here.
Research hypothesis, not tested here: who ultimately bears the adjustment?
The accounts do not reveal whether the adjustment is ultimately borne by taxpayers, users, public employees, suppliers, landowners or the households that depend on local services. Anthropy, the analytical framework put forward by the author, suggests that some costs are harder to avoid for the least mobile households: a household that depends on social housing, public transport and local facilities bears a fare increase or a closure more directly than a household that can move to another municipality. This page does not test it; it would be verified decision by decision, and would be weakened by adjustments falling mainly on well-off households or offset by social tariffs.
What these data do not say
The national aggregate mixes municipalities, inter-municipal groupings, departments, regions, syndicates and other bodies; data by category go back only to 2018, and the boundaries of the categories change with reforms (details).
A fall in investment concurrent with a cut in grants does not establish that the latter caused the former; the effect of the Cahors contracts is not measured here.
Amounts are in current euros and in points of GDP; no reading in volume is made.
These data say nothing about the quality of the services provided, nor about who ultimately bore the adjustment.
How can these results be read in your own authority’s accounts?
National results give no amount for any given authority. They show what to compare in its own accounts: its compte de gestion or single financial account (compte financier unique), or the aggregates the OFGL publishes authority by authority on data.ofgl.fr, the ones this page uses.
Resources received from the State (DGF and other grants): how they change in euros, bearing in mind that a grant replaced by a share of VAT moves into tax revenue, as in 2018 and 2021.
Tax revenue: separating the taxes whose rate the authority votes from the shares of national taxes it receives.
Gross savings: operating revenue minus operating spending; together with other own resources, it must cover repayment of debt principal.
Investment spending: in euros and relative to revenue, taking the municipal cycle into account.
For 2027, liability to the progressive contribution can be checked in article 37 of the bill (criteria, rates, exemptions), then, once the act is passed, in the ministerial order published in the Journal officiel which, according to the bill, will set the amount levied on each authority. The effect of the cut in the compensation fund’s rate shows up in the authority’s own eligible spending; the spreading of the sums placed in reserve concerns only the authorities that contributed to them in 2025 or 2026.
Frequently asked questions
How can I tell whether my local authority is affected by the draft budget bill?
The progressive contribution targets 40% of municipalities, 60% of departments and the inter-municipal groupings of metropolitan France, under the criteria of article 37 of the bill tabled on 1 October 2026; according to that text, the amount levied on each authority will be set by a ministerial order published in the Journal officiel. The national amounts give no individual amount.
How should the rise in local taxation be read?
From 2013 to 2017, local government taxes rose by €18.2 billion, more than transfers received fell (€8.9 billion); relative to GDP, they offset only part of that fall (0.39 points against 0.64 points). Since 2018, part of tax revenue has come from a reclassification: grants or abolished taxes have been replaced by shares of VAT, and this change of classification does not, on its own, say whether available resources are rising or falling. These accounts do not separate the effect of voted tax rates from that of tax bases.
Why does a fall in investment not mean a fall in total spending?
From 2013 to 2017, local government investment fell by €7.5 billion, but its other spending rose by €8.7 billion: total spending remained almost flat in euros (+€1.2 billion). Relative to GDP, which grew by 8.1% over the period, it nevertheless fell by 0.82 points. A fall in a ratio does not prove a fall in spending in euros.
National accounts — Eurostat, general government by subsector, ESA 2010: annual accounts (gov_10a_main: gross fixed capital formation P51G, current transfers received D73REC, taxes D2, D5 and D91, revenue TR, expenditure TE, balance B9), quarterly debt (gov_10q_ggdebt), debt by holding sector (gov_10dd_ggd), nominal GDP and debt from the notification (gov_10dd_edpt1), GDP from the national accounts as a check on the denominator (nama_10_gdp). The points of GDP in the waterfall are computed on the GDP of the same annual accounts; the GDP growth quoted is that of the notification.
Management accounts — OFGL, consolidated databases of municipalities, inter-municipal groupings, departments and regions (data.ofgl.fr, DGFiP data).
Texts — General Code of Local Authorities, articles L. 1612-4 and L. 1613-1; Law no. 2018-32 of 22 January 2018 on public finance programming for 2018 to 2022, articles 13 and 29; Law no. 2020-290 of 23 March 2020 on the emergency response to the covid-19 epidemic, article 12; budget acts for 2020 (art. 16), 2021 (art. 8 and 29), 2025 (art. 186) and 2026; draft budget bill tabled on 1 October 2026 and opinion of the High Council of Public Finance on that bill; all read in full and archived with their hash; Real Decreto-ley 21/2012 and Organic Law 2/2012 (Spain); Law no. 448/1998, art. 28, and Law no. 208/2015 (Italy, internal stability pact, then balanced-budget rule); Insee, Les comptes des administrations publiques [General government accounts] for 2010, 2014 and 2015 (in French); Court of Audit, Les finances publiques locales 2025 [Local public finances 2025] and published responses (in French).
The calculations, checks and figures are produced by a single script, rerun each time the sources publish; amounts are read in Eurostat and OFGL series and in archived texts (Légifrance, budget bill). The script stops if a piece of data no longer supports one of the numerical sentences it checks, or if the page uses one of the wordings it forbids. The split of the DILICO repayment, taken from Article 186 of the 2025 Finance Act, is written into the text. Download the data (CC BY 4.0 licence): CSV, in long format, readable in a spreadsheet; JSON, with the calculations, definitions and the report of the checks (variable names and labels in French).
Reusing this page
The charts, the data and a ready-made citation, under an open licence. Each chart carries its source, vintage and reading caveat inside the image: reused in a lecture or an article, it does not come apart from what makes it readable.
Local government investment and transfers received, France, in % of GDP
From 2013 to 2017, the transfers received by local government fell by €8.9 billion (0.64 points of GDP) and its investment by €7.5 billion (0.50 points); the comparable transfer series stops in 2017.
Reading caveat. Transfers received: from central government and social security, all grants together; this is not the DGF grant. Comparable series stops in 2017: in 2018 and again in 2021, some grants were replaced by shares of VAT, counted as taxes. This reclassification changes the category of the revenue; on its own, it does not say whether resources rose or fell.
Eurostat gov_10a_main, local government (S1313): investment P51G, current transfers received D73REC; France. Data retrieved on 19 October 2026.
Local government balance, 2013-2017: the same change, in euros and in percentage points of GDP
From 2013 to 2017, the local government balance improved by €9.7 billion (0.45 points of GDP). Total spending stayed almost flat in current euros (+€1.2 billion); relative to GDP, it fell by 0.82 points, of which 0.50 points for investment, while tax revenue rose and transfers received fell. These movements are concomitant; they do not attribute the fall in investment to the grant cuts.
Reading caveat. Bars: each item's contribution to the change in the balance; for spending, the opposite of its change. Other spending rose by €8.7 billion (negative bar) and fell by 0.32 percentage points of GDP (positive bar): nominal GDP rose by 8.1%. An accounting reading: the items add up to the balance; they do not say what decided it.
Eurostat gov_10a_main, local government (S1313), France; percentage points computed on the GDP of the same accounts. Data retrieved on 19 October 2026.
Lalut, Stéphane (2026). “Are local authorities the adjustment variable of public finances?”. Eurostat, OFGL and Légifrance data, retrieved 19 October 2026. https://stephane-lalut.com/en/local-government-debt/
In three sentences
Local authorities’ debt, restricted by the balanced-budget rule, is not enough to say whether a constraint from central government weighed on them: the constraint shows up in their revenue and spending. From 2013 to 2017, local government improved its balance by €9.7 billion, with spending almost flat in current euros, tax revenue up and transfers received down; relative to GDP, its spending fell by 0.82 points, of which 0.50 points for investment. These movements are concomitant and are not enough to attribute the fall in investment to the grant cuts; elsewhere, the constraint takes other forms, as in Spain, where central government holds more than half of subnational debt.
The data
The series by country and by category of authority, the DGF set by the budget act, the 2013-2017 decomposition in billions of euros and in points of GDP, the measures of the draft budget bill and the report of the checks; the same content exists as CSV, in long format, readable in a spreadsheet.
Data and charts CC BY 4.0 — free reuse, including commercial, with attribution. Text under copyright — short quotation free, full reproduction on request. The raw series belong to their producers (Eurostat, OFGL and Légifrance), under their own terms.
Revisions
— Addition: link to the local government share of the decline in net investment by general government as a whole.
— Correction: as a share of GDP, local government spending peaks in 2009 and in 2013, tied at the displayed precision, not in 2009 alone.