A debt can leave the next generations a charge, but also schools, roads and other equipment. What do the French accounts show? From 1996 to 2025, only 18% of public deficits corresponded to new public assets (equipment, buildings, land), after wear and tear; that share fell to 10% over 2016-2025. The human capital that education or health may leave behind is not counted: the figure says what deficits corresponded to, not what they produced. Two other arguments deserve scrutiny: “we owe the debt to ourselves” and “the real burden will come from ageing”. Three tests put them to the proof, without claiming to calculate each generation’s bill.
Data last updated 18 October 2026 General government, Eurostat, Insee and ECB series from 1995 to 2025; European Commission and COR, projections. Download: CSV · JSON · method
What deficits corresponded to in the accounts
Borrowing to build a school, a road or a network leaves capital as well as a debt. This is an essential argument in assessing the weight of that debt on future generations, provided we know what was acquired and what it will bring. The national accounts answer the first question.
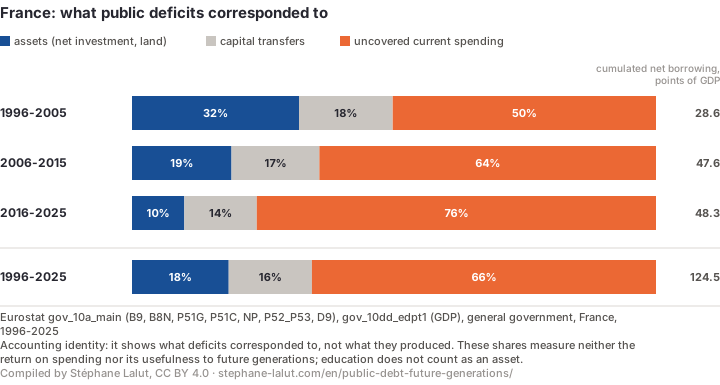
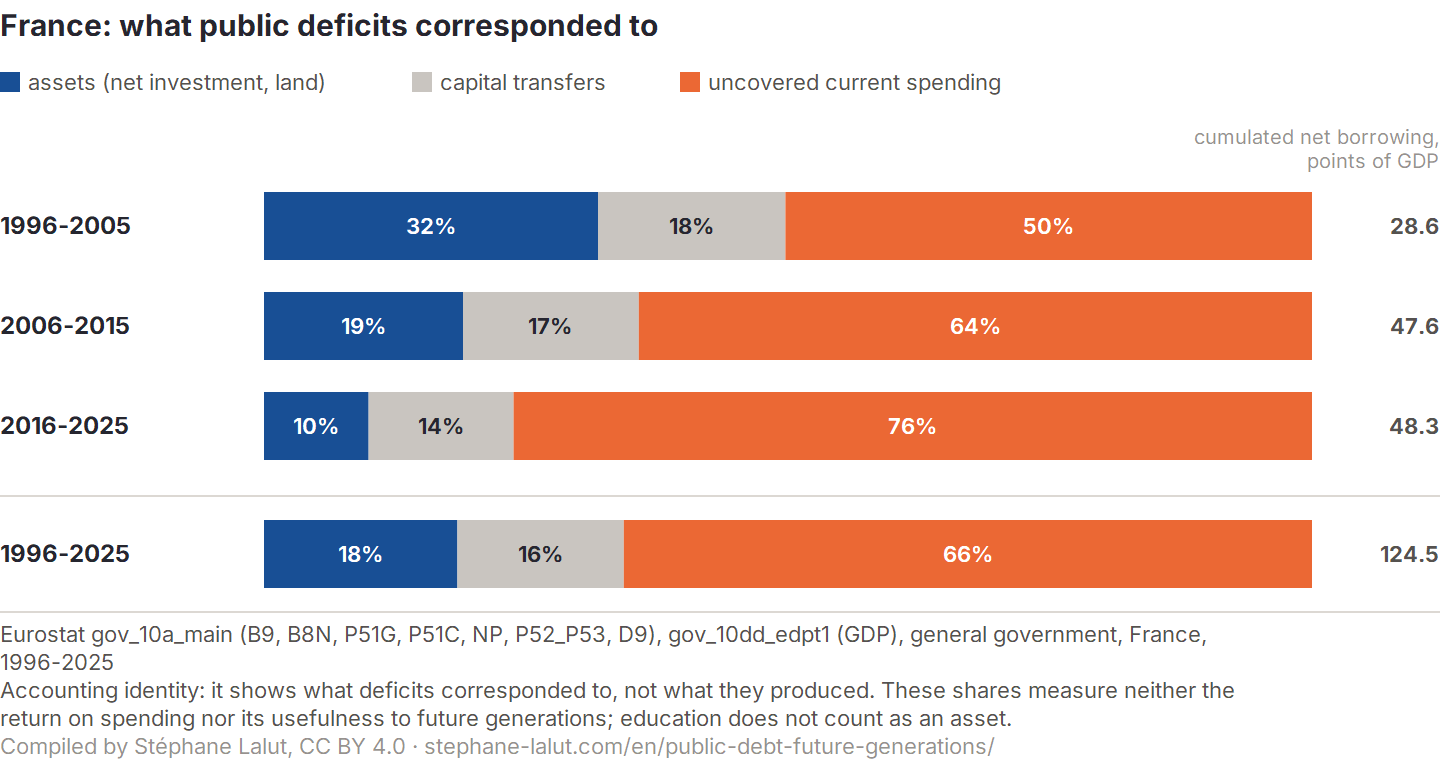
Share of French general government net borrowing that corresponded to assets, to capital transfers and to uncovered current spending, by decade (Eurostat, author’s calculation).
The finding in one sentence. From 1996 to 2025, only 18% of French public deficits corresponded to a net increase in recorded public assets, and 66%, nearly two thirds, to current spending that current revenue did not cover; the share in assets fell from 32% over 1996-2005 to 10% over 2016-2025. This is an accounting reading: it says what deficits corresponded to, not what they produced.
Every year, the public deficit breaks down exactly into three uses. Net acquisitions of assets: additional public equipment, land and inventories, once the wear and tear of what already exists has been deducted. Capital transfers, 16% of the total: grants paid to others, firms, households or other bodies, so that they invest, minus revenue of the same kind. Uncovered current spending: the part of current spending (running costs, social benefits, interest…) that current revenue did not cover. Since public money is not earmarked for a given expense, this breakdown does not say which borrowed euro paid for which expense: it says what, overall, the deficit corresponded to.
The three uses in accounting terms, and what the cumulated amounts mean
Net acquisitions of assets are investment, minus the wear and tear of existing capital, plus net purchases of land and changes in inventories; only this surplus adds to public net worth. Net capital transfers are investment grants paid to other sectors, minus capital revenue, inheritance taxes included. Uncovered current spending is the excess of current spending, wear and tear of capital included, over current revenue, which accountants call dissaving.
The shares can be read directly. The amounts, for their part, add up yearly net borrowing, each relative to the GDP of its year: the 124.5 points of GDP cumulated from 1996 to 2025 are neither 124.5% of 2025 GDP nor the rise in the debt ratio over the period. Investment grants paid to firms, households or bodies outside general government totalled 25.5 points of GDP, cumulated over the period.
The share in assets fell decade by decade, from 32% to 19% and then to 10%, and the two declines do not reflect the same accounting movement. From the first decade to the second, the share fell mainly because cumulated net borrowing rose, from 28.6 to 47.6 points of GDP, while net acquisitions of assets stayed almost unchanged (9.1, then 9.0 points); from the second to the third, net borrowing stayed almost the same (48.3 points) and net acquisitions of assets nearly halved (4.8 points). Over the last decade, net acquisitions of assets amounted to only 0.5 points of GDP a year on average. In thirty years, current revenue exceeded current spending in only two years, 2000 and 2001, and in no year did acquisitions of assets match net borrowing. Even counting as capital acquired all the investment grants paid outside general government, the share would reach 39% at most: still less than half.
Where the decline took place. The accounts do not say why the invested share fell, but they do locate the decline. General government net investment, investment minus wear and tear on capital (gross fixed capital formation minus consumption of fixed capital), fell from 0.75 points of GDP a year on average over 2006-2015 to 0.33 points over 2016-2025. Over these two periods, local government accounts for 0.24 points out of a decline of 0.42 points, or 56%; the other government bodies, central government and social security, for the rest. This split depends on the years compared (details below). The decline was not steady: local net investment reached its low point in 2016, at 0.03 points of GDP, when local authorities’ gross investment barely covered the estimated wear and tear on their capital. It was back at 0.47 points in 2024, then 0.53 points in 2025, a value to read with caution: the consumption of fixed capital published for 2025 is identical to that of 2024. The 2016 trough came two years after the 2014 municipal elections, while the transfers received by local government were falling: the page Local authorities: the adjustment variable? shows that the comparison with earlier cycles weakens the explanation by the municipal calendar alone, without isolating the effect of transfers or grants.
The local share of the decline depending on the years compared
Taking as reference each of the eleven periods of ten consecutive years between 1996 and 2015, compared with 2016-2025, the local government share of the decline ranges from 56% (2006-2015, the period used above) to 81% (1998-2007). Without the last year, it is 57%; without the stimulus years, 2009 and 2010, 66%. These periods overlap: they are variants of one calculation, not independent observations.
What this share does not measure. That only 18% of deficits correspond to recorded assets does not mean that the remaining 82% produced nothing. The accounts record counterparts, not all benefits: education, health and non-capitalised research are current spending, which may leave the following generations a human capital that these series do not count. Nor do these shares measure the return on spending, or whether a deficit run in a recession, which spreads the effort over time, was justified.
Neither universal nor exceptional. The same calculation, applied to the 27 EU countries over a common window from 2001 to 2025, puts France at 17% (against 18% over 1996-2025: the difference comes from the window). Among the 21 countries whose cumulated net borrowing reached 30 points of GDP, the share in assets reached at least one half in four, including Romania (61%) and Slovenia (61%); it was lower than in France in eight, including Italy (3%) and Slovakia (1%). The composition of deficits is therefore not a fate common to all states.
The 27 countries, use by use
Country
Share in assets
Net borrowing
Assets
Capital transfers
Uncovered current spending
Denmark
not applicable
−38.0
7.7
14.6
−60.2
Luxembourg
not applicable
−25.8
52.4
22.5
−100.6
Sweden
above net borrowing
1.3
30.4
1.7
−30.9
Estonia
above net borrowing
9.0
65.4
−8.9
−47.5
Finland
above net borrowing
10.1
14.7
−1.4
−3.3
Bulgaria
above net borrowing
25.0
25.2
−8.9
8.7
Cyprus
62%
56.1
34.6
26.5
−5.0
Slovenia
61%
78.4
48.1
10.5
19.8
Romania
61%
107.9
65.5
5.4
37.0
Lithuania
50%
53.6
26.9
−7.5
34.2
Croatia
44%
86.1
38.2
26.2
21.6
Poland
43%
103.0
44.0
1.0
58.0
Ireland
43%
77.7
33.1
27.3
17.3
Malta
42%
76.1
31.8
−6.8
51.1
Latvia
41%
67.1
27.8
−8.8
48.1
The Netherlands
34%
37.6
13.0
4.6
20.1
Spain
25%
104.3
26.2
6.0
72.1
Hungary
20%
122.5
24.8
19.4
78.3
France
17%
111.6
19.0
16.8
75.9
Greece
16%
143.8
23.4
0.2
120.2
Austria
15%
66.2
9.9
27.3
29.0
Portugal
11%
100.9
11.0
7.5
82.4
Belgium
9%
70.5
6.5
16.4
47.6
Czechia
7%
67.9
4.8
18.2
44.9
Germany
5%
38.0
1.9
22.3
13.9
Italy
3%
96.7
3.1
33.7
60.0
Slovakia
1%
98.0
0.7
2.5
94.8
Points of GDP cumulated from 2001 to 2025; assets: investment minus depreciation of capital, land and inventories; negative net borrowing means cumulated surpluses (“not applicable”); “above net borrowing”: net acquisitions of assets exceed net borrowing, the difference corresponding to positive public saving. Source: Eurostat, author’s calculation.
Bulgaria, Denmark, Estonia, Finland, Luxembourg and Sweden, whose cumulated net borrowing stayed below that threshold or was negative, cannot be compared on this ratio.
The general government balance sheet: a complement, not a proof
The general government balance sheet seems to offer confirmation: from 1995 to 2025, its net worth — all its non-financial assets, produced or not, minus its debts net of its financial assets — went from 37.1% to 25.0% of GDP. But this stock depends on the two years being compared. It reached 61.6% in 2007, was still above its starting level in 2022 (40.3%), and it rose by 8.1 points from 2016 to 2025, the decade in which the share of deficits corresponding to assets fell to 10%. Of the 231 possible comparisons between two years at least ten years apart, 55 show it rising.
Its changes mix flows and revaluations. The value of land changed by +28.8 points of GDP over the period, unrelated to deficits; even produced assets, which changed by only +0.9 points, are stocks valued at current prices and relative to GDP, sensitive to prices as well as to the denominator. A flow identity, checked year by year, is not validated by a stock whose changes also obey other mechanisms: the balance sheet remains complementary information here.
The “we owe it to ourselves” argument
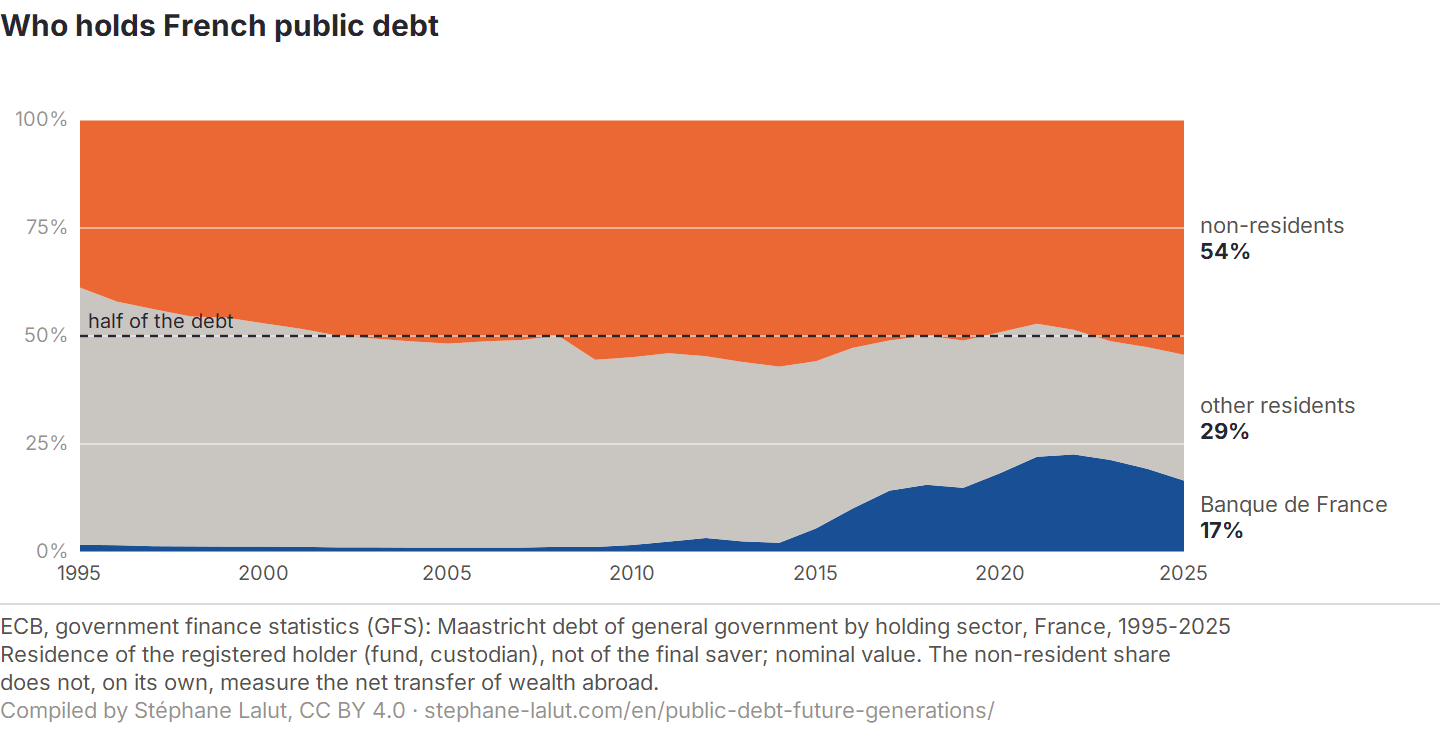
The economist Abba Lerner’s classic argument assumes that the debt is held within the country: servicing it would then amount to levying national taxpayers to pay national savers, and the generation that pays would also be the one that receives. Holdings statistics make it possible to check its premise, not its conclusion.
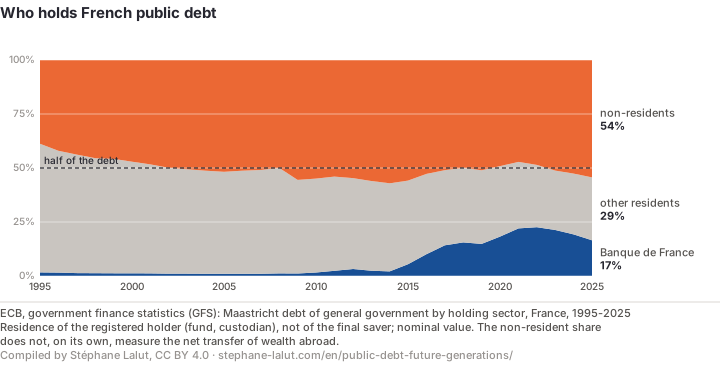
Share of general government debt held by non-residents, the Banque de France and other residents (ECB, government finance statistics).
In 2025, 54.3% of French public debt was recorded as held by non-residents, and 45.7% by residents (ECB). Of the latter, the Banque de France held 16.5% of the total, and other residents 29.2%. The Banque de France is set apart because its role is not that of an ordinary private creditor: its holdings rose sharply with the Eurosystem’s purchases of public securities, before receding. With more than half of the debt held by non-residents, the assumption of a debt held entirely within the country does not describe the French situation. It describes Italy (34% of debt held by non-residents in 2025) or Sweden (23%) better, and Austria (66%) or Belgium (63%) less well.
It has not always been so. In 1995, 38.8% of the debt was held by non-residents; the share passed one half in 2003 and stayed above it in 18 years out of 23 since. With these purchases, the Banque de France became a major holder, with up to 22.6% of the debt in 2022; since then, its holdings have been receding and the non-resident share has risen by 5.8 points. The page Who really pays for public debt? breaks central-government securities down by holder, and Did inflation really ease France’s debt burden? shows who held the debt when inflation reduced its real value.
Holders year by year, and the scope of central-government securities
The non-resident share peaked at 57.1% in 2014. The Banque de France held 1.7% of the debt in 1995; since 2016, it has held more than a tenth of it, and the growth of its holdings has offset the decline of other residents, from 40.8% in 2014 to 29.2% in 2025. In 2025, it held 6.1 points less than in 2022.
On the narrower scope of central-government marketable securities, at market value, the Banque de France describes the same movement: 56.0% held by non-residents at end-2025, a trough of 47.5% in 2021, at the height of central bank purchases, and 57.5% in the first quarter of 2026 according to Agence France Trésor, the French debt management office. The general government series is at nominal value, the series for central-government marketable securities at market value: their levels cannot be compared point by point.
What holdings statistics do not establish. They show where creditors are registered, not who bears the charge. They establish neither the residence of each final saver, since a foreign fund may manage the savings of French households and vice versa; nor the net charge left to the following generations; nor France’s net external position, since residents also hold claims on the rest of the world; nor the effects of the debt on capital, incomes and growth. A debt held at home is not neutral for all that: servicing it involves payments, drawn from public resources, to those who hold the securities. And a debt held abroad is not, mechanically, a net loss equal to its value.
Does future ageing weigh more than the current budget imbalance?
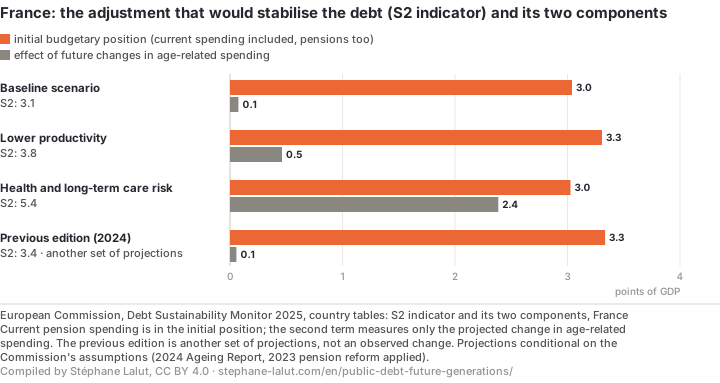
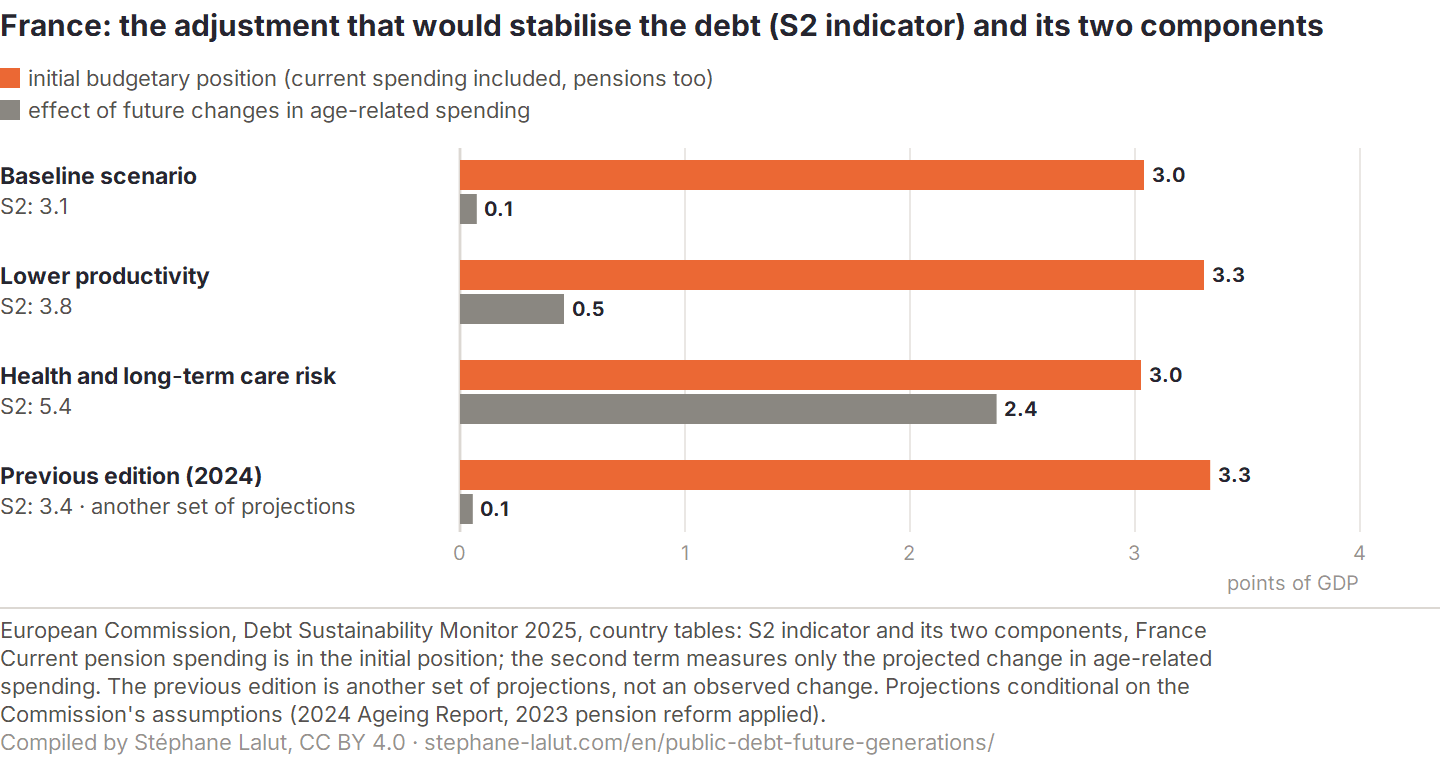
The third argument treats the visible debt as secondary: the real burden would come from ageing. The European Commission makes it possible to test this with its S2 indicator: the permanent improvement in the budget, excluding interest on the debt, that would stabilise debt relative to GDP in the long term, with neither the date nor the level of stabilisation set in advance. To stabilise its debt in the long term, France would thus have to durably improve its budget by 3.1 points of GDP, under the Commission’s assumptions (Debt Sustainability Monitor 2025).
Of these 3.1 points, 3.0 points correspond to the initial budgetary position, that is, the gap between the current budget and the one that would stabilise the debt, and 0.1 points to the effect of future changes in age-related spending (pensions, health, long-term care, education), which the Commission labels the “cost of ageing”.
A small effect of the future change does not mean that pensions cost little. Current pension spending, 14.1% of GDP in 2025 in gross terms according to the Conseil d’orientation des retraites (COR), the French pensions advisory council, is already counted in the initial position; the second term measures only its projected change, added to that of other age-related spending.
Adjustment that would stabilise French debt (S2 indicator), split between the initial budgetary position and the effect of future changes in age-related spending, according to the European Commission (three scenarios and previous edition).
The result depends on the assumptions. In the risk scenario where the Commission assumes heavier health and long-term care spending, the effect of future changes in age-related spending reaches 2.4 points, against 0.1 points in the baseline scenario; S2 then reaches 5.4 points. The initial position nevertheless remains the larger term there, as in the lower-productivity scenario. Yet the indicator can show the opposite: in 15 EU countries out of 27, including Belgium, Spain and Luxembourg, the future change in age-related spending weighs more than the initial position.
The COR, for its part, projects pension spending rising as a share of GDP, where the Commission assumes a fall: the two projections rest on different assumptions and cannot be compared directly.
Technical definition of S2, and the second term item by item
S2 is the permanent improvement in the structural primary balance (the balance excluding interest, adjusted for the economic cycle), made in 2027, that would stabilise the debt over an infinite horizon. Unlike the S1 indicator, which targets 60% of GDP by 2070, it sets neither the level at which the debt stabilises nor the date. The initial budgetary position is the gap between the starting structural balance and the one that would stabilise the ratio.
The effect of future changes in age-related spending is small because it nets out opposite movements. The Commission projects pension spending falling as a share of GDP (−0.5 points), net of the taxes and contributions paid by pensioners, with the 2023 reform applied; health spending (+0.6 points) and long-term care spending (+0.6 points) rise; education spending falls (−0.6 points).
Commission and COR: two projections, two sets of assumptions
Who is speaking matters here. The Commission is the institution that enforces the European fiscal rules. The COR, a pluralist body that brings together the social partners, members of parliament and government departments, projects in its baseline scenario (annual report of June 2026) gross pension spending rising from 14.1% of GDP in 2025 to 15.3% in 2070, a change of +1.2 points, where the Commission assumes a fall. The two figures cannot be compared term by term: one is gross spending between two dates, the other a net component. Their gap, which may stem from each institution’s assumptions, shows how much the projection depends on them; it does not yield another S2.
The COR bases its projection on INSEE’s new demographic projections, with lower fertility and higher net migration than in its previous reports, and stresses how much its financial diagnosis depends on them; the Commission uses the ageing projections of its 2024 report, drawn up before them. The COR also assumes, for Agirc-Arrco, the supplementary pension scheme for private-sector employees, an uprating of the pension point that is less restrained from 2038 than in its earlier reports, which raises projected spending. Part of the gap between the two institutions may therefore stem from their assumptions, and not from the financial situation of the pension system alone.
The deficit the COR projects for the pension system, 2.4 points of GDP in 2070, stems as much from the projected fall in its resources, from 13.9% to 12.9% of GDP, as from the rise in its spending. These are projections conditional on their assumptions.
The Commission’s previous edition (2024) gave 3.3 for the initial position and 0.1 for the future change in age-related spending: this is another set of projections, not an observed change.
S2 is not the gap calculated on another page of the dossier
The page Can public debt come down? measures a gap of similar size: 2.9 points of GDP in 2025, against 3.1 points for S2. The first concerns the observed balance of a single year; the second is a permanent adjustment, which includes the projected change in age-related spending. The two numbers are neither two interchangeable estimates nor a validation of each other.
Value. Part 5: 2.9 points of GDP in 2025. S2: 3.1 points of GDP (Debt Sustainability Monitor 2025).
Nature. Part 5: observed primary balance, one year. S2: structural primary balance, permanent adjustment from 2027.
Horizon. Part 5: stabilise the ratio that year, at that year’s interest rate and growth. S2: stabilise the debt over an infinite horizon, with no set level or date.
Age-related spending to come. Part 5: not projected. S2: projected change included.
What S2 does not say. It does not say which spending or which revenue should change, or whether pensions pose a problem: it is a projection conditional on its assumptions.
Why none of these figures is a bill
The three tests answer three different questions. The composition of deficits says what they corresponded to in the accounts; holdings say where creditors are registered; S2 says what adjustment would stabilise the debt, under assumptions. None measures what each generation will pay and receive over its lifetime: that is the subject of generational accounting, which these series do not construct.
What will my children actually pay? None of these series can put a figure on a bill per child: that would require knowing future policies. They do shed light on the mechanisms through which a debt weighs, or not, on those who come after. A debt is rolled over: the government repays maturing securities by issuing others, and no particular generation repays all of it. It may call for future adjustments, higher taxes or lower spending, if the balance does not stabilise it. It may weigh on capital, if the saving placed in it stops being invested elsewhere. And it may have come with assets and services from which the following generations benefit: the roads and schools counted here, the education and health that are not.
Finally, the weight of the same stock depends on the gap between the interest rate the government pays and the growth of the economy. When the rate exceeds growth, stabilising the debt ratio requires a primary surplus; when it is below growth, a primary deficit can leave it stable. The page Can public debt come down? measures this gap for France.
What these data do not say
What current spending produced. The page assesses the argument on the scope of recorded assets, not the value of all spending.
Causality. The uses of net borrowing say what deficits corresponded to in the accounts, not why they existed, nor what would have happened without them.
The final holder. Residence is that of the registered holder, not of the final saver.
The future. S2 and the COR projections are scenarios conditional on their assumptions (demography, productivity, legislation), produced by two institutions with different mandates; they cannot be validated by observation.
Distribution within a generation. None of these series says who, within the same generation, pays and receives: that is the subject of Who really pays for public debt?
The anthropic reading: who decides today, who will have to adapt tomorrow?
The anthropic framework does not settle the macroeconomic controversy; it moves the question from the volume of debt to participation in decisions and the future distribution of adjustments. It comes down to three propositions.
One generation can commit to spending whose consequences concern people absent from the decision: no one votes “against” future generations; people vote for budgets part of whose costs will fall to them.
A transfer over time does not, on its own, determine who will actually bear the charge: within each generation, the adjustment may go through taxes, user charges, services or savings, and not fall on the same people.
Unequal capacities for mobility, avoidance or negotiation may influence that distribution: mobile households, fiscally or geographically, have room for manoeuvre that the least mobile lack.
The third proposition is a refutable hypothesis, not a finding of this page. It is tested on specific reforms, with groups defined in advance; it would be weakened by an adjustment falling mainly on other groups, or by compensation granted to the losers. It is formalised in AWP-03; AWP-09 confronts this reading with the public accounts, without establishing the final burden on each generation.
That leaves the question these accounts keep open: will those who must bear the consequences of today’s decisions have the same possibilities of choice, adaptation and protection as those who benefited from them?
Tested against the research literature: the use criterion and the decline in investment are found again; reading resident holding as an absence of burden, or the composition of deficits as a measure of the burden between generations, is challenged
Measured here. The uses of French and European general government net borrowing, general government net worth, debt holdings by sector, on Eurostat, Insee and ECB series; the breakdown of the S2 indicator, taken from the Commission. None of the texts read calculates these quantities on these sources and these periods: they are validated by reproduction.
Consistent with. The use criterion: in Diamond’s model, issuing debt to acquire public capital makes the government a mere intermediary between savers and entrepreneurs, with no short-run or long-run effect. The decline in the share invested: in 21 OECD countries, including France, from 1979 to 2003, a heavier interest burden goes together, five years later, with a lower share of public investment and a higher share of pensions, postponing an investment costing less, politically, than cutting an entitlement (Breunig and Busemeyer). These are associations in a panel, over another period: they do not say why the share invested has fallen in France since. The approach of the S2 indicator, finally, is the one called for by Auerbach, Gokhale and Kotlikoff: starting from the government’s budget constraint over a long horizon and from age-related spending, rather than from a single year’s deficit.
Challenged by. Any reading of the breakdown of deficits as a measure of the burden between generations. For Auerbach, Gokhale and Kotlikoff, the measured deficit has, in theory, no necessary relationship with the stance of fiscal policy between generations: it depends on how revenue and spending are labelled. They replace it with generational accounts, which estimate what each generation pays and receives over the rest of its life; for the United States in 1989, under unchanged policy, they found a net burden about 20% heavier for future generations than for newborns. Hence the page’s limit: its breakdown gives the accounting composition of deficits, not the burden on each generation. Any reading, too, according to which only the share held by non-residents would weigh on the following generations. In the efficient case of Diamond’s model, where the interest rate exceeds population growth, internal debt lowers long-run welfare more than external debt, because it takes the place of productive capital in wealth holdings. In Blanchard, even a debt rolled over without ever raising taxes reduces capital accumulation; in the case he regards as most representative, welfare rises for the first generation and generally falls afterwards, calculations he himself describes as too rudimentary for an estimate. Barro argues the opposite: altruistic parents would offset the burden through their voluntary transfers, provided these transfers are operative for most people; he acknowledges that in 1989 most economists leaned towards the models in which debt weighs.
Not established. The extent to which capital is crowded out in France, and the value of what current spending produced for the following generations: none of the five texts measures them.
References read
Diamond, P. A. (1965), “National Debt in a Neoclassical Growth Model”, American Economic Review, 55(5), pp. 1126-1150.
Auerbach, A. J., Gokhale, J. and Kotlikoff, L. J. (1991), “Generational Accounts: A Meaningful Alternative to Deficit Accounting”, Tax Policy and the Economy, 5, pp. 55-110.
Barro, R. J. (1989), “The Ricardian Approach to Budget Deficits”, Journal of Economic Perspectives, 3(2), pp. 37-54.
Blanchard, O. (2019), “Public Debt and Low Interest Rates”, American Economic Review, 109(4), pp. 1197-1229 (read in its PIIE working paper version, no. 19-4).
Breunig, C. and Busemeyer, M. R. (2012), “Fiscal austerity and the trade-off between public investment and social spending”, Journal of European Public Policy, 19(6), pp. 921-938.
Literature review checked on 3 October 2026: every reference cited was read in full on that date, in the version indicated.
Summary
What to take away
What holds. Use distinguishes one debt from another, and the French share is low: 18% of deficits have corresponded to recorded assets since 1996, 10% over 2016-2025, while other EU countries exceed one half. The assumption of a debt held at home does not describe France: 54.3% of public debt was registered to non-residents in 2025.
What is not enough. None of these figures is a bill: the composition of deficits is not a charge per generation, the residence of creditors is not a net transfer, and S2 is a conditional projection.
What cannot be concluded. A debt that corresponds little to recorded assets is not necessarily a debt without benefit. A debt held at home is not necessarily painless. A small effect of the future change in age-related spending does not imply low current pension spending.
To judge what debt leaves to future generations, knowing its amount is not enough: one must know what was acquired at the same time, to whom it is owed, on what conditions it stabilises, and how costs and benefits will be shared.
Frequently asked questions
Does public debt weigh on future generations?
It leaves them a charge, and also what was acquired at the same time; no single statistic measures the balance of the two. In France, from 1996 to 2025, 18% of public deficits corresponded, in the accounts, to a net increase in recorded public assets, 16% to capital transfers to other sectors and 66% to current spending that current revenue did not cover. This is an accounting composition: it measures neither what each generation will pay, nor what current spending on education or health produced.
Does debt taken on to invest weigh less?
It leaves capital along with the charge: that is why use is a relevant criterion, though it does not say what the spending yields. In France, the share of deficits that corresponded, in the accounts, to a net increase in public assets went from 32% (1996-2005) to 19% (2006-2015), and then to 10% (2016-2025). These shares measure neither the return on spending nor its usefulness to future generations.
The “we owe it to ourselves” argument: does it hold for France?
In 2025, 45.7% of general government debt was recorded as held by residents and 54.3% by non-residents (ECB): the assumption of a debt held entirely within the country does not describe France. This statistic gives the residence of registered holders, not the burden: it measures neither the net charge left to the following generations nor the country’s net external position. And a debt held at home is not painless for all that.
Are pensions the real burden?
The European Commission’s S2 indicator does not answer that question in that form. It puts at 3.1 points of GDP the permanent adjustment that would stabilise French debt, of which 3.0 for the initial budgetary position, which includes current pension spending, and 0.1 for the future change in age-related spending (Debt Sustainability Monitor 2025). That small second term does not mean that pensions cost little; and the Conseil d’orientation des retraites (COR), the French pensions advisory council, projects rising pension spending where the Commission assumes a fall.
What will future generations actually pay?
These series cannot put a figure on a bill per child: that would require knowing future policies. A debt is rolled over without any particular generation repaying all of it; it may call for future tax or spending adjustments, weigh on capital accumulation, or come with assets and services from which those who follow will benefit. Its weight also depends on the gap between the interest rate the government pays and the growth of the economy.
Uses of net borrowing. Eurostat, general government (S.13), ESA 2010 accounts, in national currency (gov_10a_main): net lending or borrowing (B9), net saving (B8N), gross fixed capital formation (P51G), consumption of fixed capital (P51C), acquisitions less disposals of non-produced assets (NP), changes in inventories (P52_P53), capital transfers paid and received (D9), of which investment grants paid (D92). Each year, net borrowing = net dissaving + net acquisitions of assets + net capital transfers; the identity is checked year by year, to within 0.05 points. Ratios are calculated on the GDP published with the deficit and debt notification (gov_10dd_edpt1) and cumulated by period in points of GDP; the share in assets calculated in current euros gives 17%, against 18% in points of GDP. Excluding land and inventories, net investment alone represents 15% of net borrowing.
Net worth. Insee’s general government balance sheet (table 8.204, annual national accounts, base 2020, corrected on 30 July 2026, file archived with its hash): produced and non-produced non-financial assets (N1N and N2N, current prices), of which land (N211N), and net financial worth (financial assets minus liabilities), relative to GDP. Two cross-checks, which must agree or the run stops: the non-financial assets published by Eurostat (nama_10_nfa_bs) and Eurostat’s quarterly net financial worth in the fourth quarter (nasq_10_f_bs, BF90). Asset stocks are valued at current prices: their changes mix flows and revaluations.
Holdings. ECB, government finance statistics (GFS): Maastricht debt of general government by counterpart area (rest of the world, residents) and holding sector (central bank). Checks: non-residents and residents add up to total debt each year; over the common years, the values equal those of Eurostat (gov_10dd_ggd), reported by the same administration. Scope witness: Banque de France, series DET.Q.FR.1315.F33000.M.Z9.8.F, on Webstat (share of central-government marketable securities held by non-residents, at market value, end of quarter; file from the series’ public page, latest observation published on 7 April 2026, archived with its hash); latest observation: chart from Agence France Trésor (source Banque de France), read on 3 October 2026 with the image’s hash, and checked against Webstat over the common period. The script stops if the two series cease to converge, or if Webstat publishes a period that the reading no longer goes beyond.
S2 indicator. European Commission, Debt Sustainability Monitor 2025, country tables (file of the edition, archived with its hash): the components used are those of the spreadsheet; table 3.2 of the report prints the initial position as the difference between S2 and the second term, hence 3.1 instead of 3.0 for France. Definitions of S2, of its two terms and of S1: section 3.1 and annex A6 of the report (Institutional Paper 332), read for this page. Part 5. The gap to the stabilising balance is read from the data of Can public debt come down?; the script stops if the year or the value differ. Pensions. COR, annual report of June 2026, data from the summary, baseline scenario; Agirc-Arrco indexation rule: part 1, chapter 2 of the report.
Check: for each country and each year, the calculated ratios are compared with those Eurostat publishes as a percentage of GDP, which the calculation does not use. Beyond a gap of 0.11 points, the year is excluded and counted (0 out of 837); for France, the script stops. The computed figures all come from the same script, which checks the main quantitative statements and stops if their conditions are no longer met; their wording is reviewed editorially. Only the latest non-resident share, read on the Agence France Trésor chart, is transcribed by hand; the reading for the previous quarter is checked against Webstat. Figures from the studies cited are given as they publish them. The arguments were tested before the page was written, following a protocol set before the calculation.
Reusing this page
The charts, the data and a ready-made citation, under an open licence. Each chart carries its source, vintage and reading caveat inside the image: reused in a lecture or an article, it does not come apart from what makes it readable.
France: what public deficits corresponded to
Over thirty years, the share of French deficits that corresponded, in the accounts, to a net increase in public assets has fallen decade by decade; the largest share corresponded to current spending that current revenue did not cover. These shares measure neither the return on spending nor its usefulness.
Reading caveat. Accounting identity: it shows what deficits corresponded to, not what they produced. These shares measure neither the return on spending nor its usefulness to future generations; education does not count as an asset.
Eurostat gov_10a_main (B9, B8N, P51G, P51C, NP, P52_P53, D9), gov_10dd_edpt1 (GDP), general government, France, 1996-2025
The share of French debt held by non-residents has been above half in most years since the early 2000s; Banque de France purchases pushed it down, and the ebb of its holdings is pushing it back up. This is the residence of registered holders, not a measure of the burden.
Reading caveat. Residence of the registered holder (fund, custodian), not of the final saver; nominal value. The non-resident share does not, on its own, measure the net transfer of wealth abroad.
ECB, government finance statistics (GFS): Maastricht debt of general government by holding sector, France, 1995-2025
France: the adjustment that would stabilise the debt (S2 indicator) and its two components
According to the Commission's S2 indicator, the adjustment that would stabilise French debt mainly reflects the initial budgetary position, which includes current pension spending; the effect of future changes in age-related spending is small in the baseline scenario and much larger in the risk scenario.
Reading caveat. Current pension spending is in the initial position; the second term measures only the projected change in age-related spending. The previous edition is another set of projections, not an observed change. Projections conditional on the Commission's assumptions (2024 Ageing Report, 2023 pension reform applied).
European Commission, Debt Sustainability Monitor 2025, country tables: S2 indicator and its two components, France
Lalut, Stéphane (2026). “Is public debt a burden on future generations?”. Eurostat, Insee, ECB, European Commission, COR data, retrieved 18 October 2026. https://stephane-lalut.com/en/public-debt-future-generations/
In three sentences
From 1996 to 2025, 18% of French general government net borrowing corresponded, in the accounts, to a net increase in its recorded assets, and 66% to current spending not covered by current revenue; the share in assets went from 32% (1996-2005) to 10% (2016-2025). This is an accounting reading, not a causal attribution: these shares measure neither the return on spending nor its usefulness to future generations. In 2025, 54.3% of public debt was registered to non-residents, which gives the residence of holders, not the burden.
The data
The uses of general government net borrowing (France by decade, 27 EU countries), general government net worth, debt holdings by sector and the Commission’s S2 indicator; the same content exists as CSV, in long format.
Data and charts CC BY 4.0 — free reuse, including commercial, with attribution. Text under copyright — short quotation free, full reproduction on request. The raw series belong to their producers (Eurostat, Insee, ECB, European Commission, COR), under their own terms.
Revisions
— Addition: where the decline in net investment took place, local government and other government bodies, with its 2016 low point and the local share of the decline depending on the years compared (counter-review of 18 October).