Public debt: why 100% of GDP does not carry the same burden everywhere
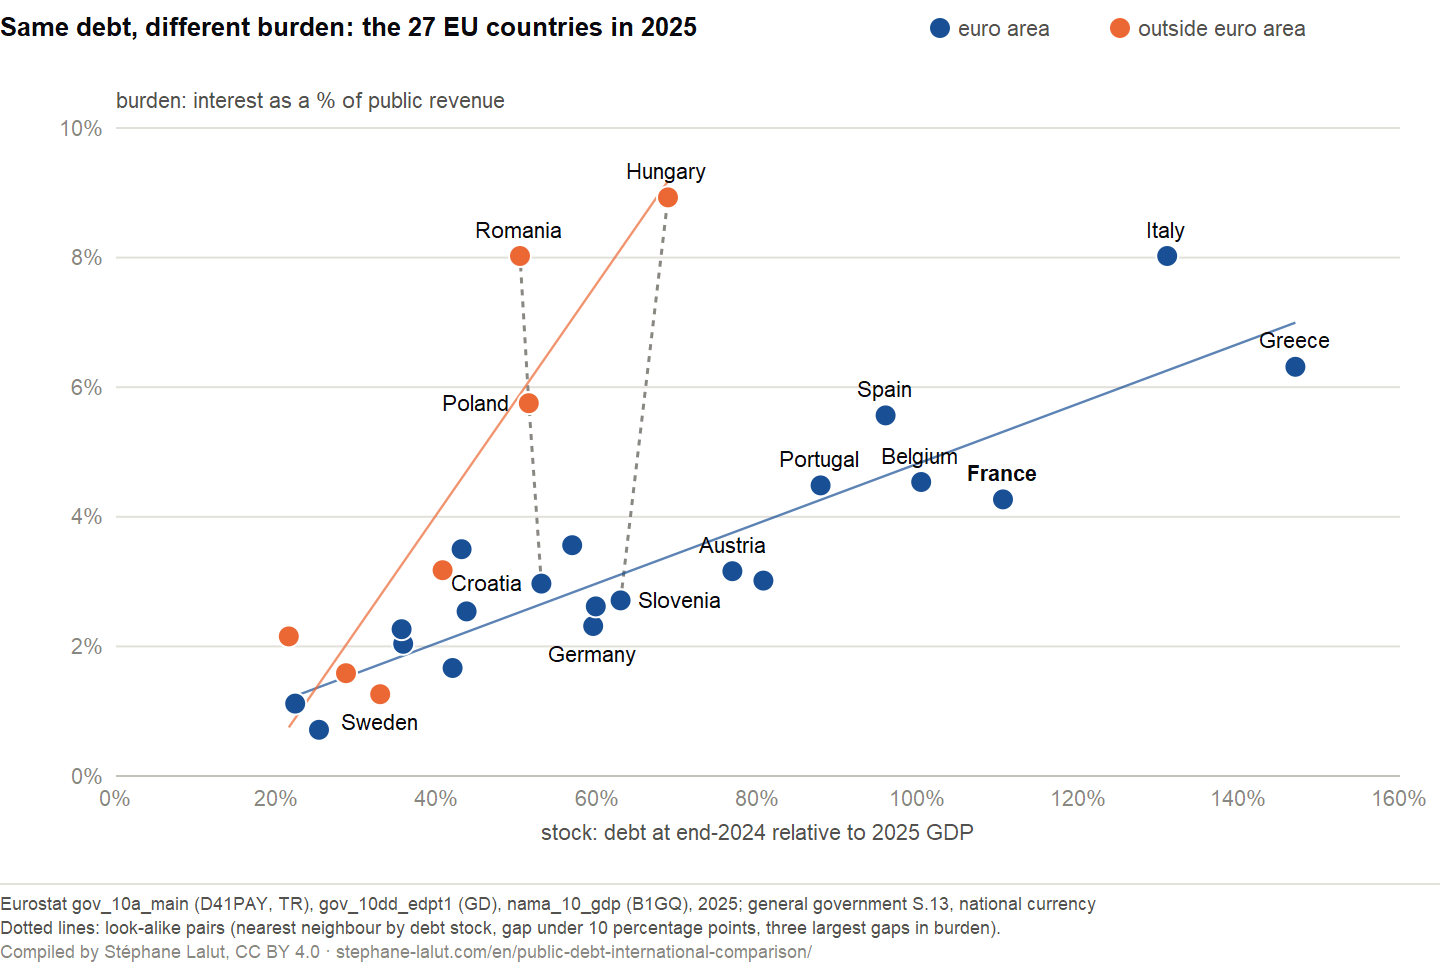
At almost equal debt levels, Hungary devotes 8.9% of its public revenue to interest; Slovenia, 2.7%. The stock alone therefore cannot measure what a public debt weighs: one must also look at its average interest cost, the revenue available to service it and the speed at which new financing conditions pass through.
Updated: 30 September 2026 The 27 countries of the European Union, main data 2025; outside Europe, the vintage is given country by country. Download: CSV · JSON · method
The debt-to-GDP ratio is one of the most widely quoted figures in public-finance comparisons, and on its own it does not say what a debt costs. This page sets France alongside the other members of the European Union and a few economies beyond Europe, and asks what the ratio leaves out.
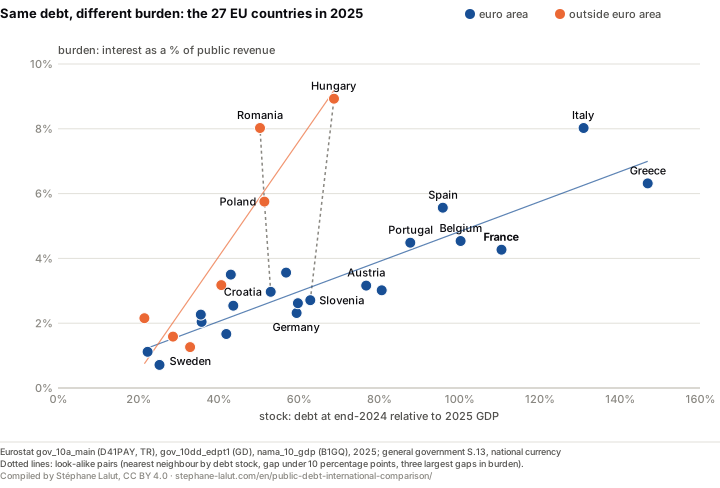
Same debt, different burden
Starting stock (debt at the end of 2024 / GDP 2025) and burden (interest / revenue), 2025. The dotted lines link look-alike pairs — countries with similar debt ratios — picked out by a rule set before the calculation: for each country, its nearest neighbour in stock; pairs less than 10 points apart; the three largest gaps in burden.
The result in one sentence. At similar levels of debt, the share of revenue absorbed by interest can vary from 1 to 3.3: the stock is not enough to determine the burden, because it fixes neither the average interest cost of the debt nor the level of public revenue.
The stock is not unrelated to the burden: ranked by debt and by burden, countries fall into a similar order (rank correlation of 0.76). But it accounts for only part of the dispersion (R² = 0.40), and the figure shows why. Within the euro area, the stock accounts for most of the cross-country variation in the burden (R² = 0.82 across 20 countries); the same holds among the 7 countries outside the euro area (R² = 0.83). But the two groups do not follow the same line: outside the euro, the burden rises much faster with debt, in particular because the most indebted countries there also pay more. The slope does not depend on any single country: removing each of the seven in turn, it stays between 0.165 and 0.210.
France illustrates the other side: with debt of 110.5% of GDP at the start of the year, it devoted 4.3% of its revenue to interest in 2025, less than 6 less indebted countries: Romania, Poland, Hungary, Portugal, Spain, Belgium.
Why? One equation, four measures
The burden debt places on public revenue depends on three things
the debtstarting stock, % of GDP×its average costimplicit interest rate÷public revenue% of GDP=the burdeninterest as % of revenue
Exact identity, checked for each country: interest / revenue = (debt at the end of the previous year / GDP) × (interest / debt at the end of the previous year) ÷ (revenue / GDP)
The stock: public debt relative to GDP, the most quoted figure. It is read at two dates: the starting stock (debt at the end of the previous year, relative to the year’s GDP) explains the year’s interest — it is the one used in the figure and the opening; the closing stock (debt at the end of the year) is used for the ranking further down.
The cost: the average interest cost, measured by the implicit interest rate, that is, the interest paid in a year divided by the debt at the end of the previous year. It measures the average cost of the stock, not the rate at which a State borrows today. Eurostat also publishes an “apparent cost”, based on the year’s average debt: the two conventions are close but not identical.
The burden: the share of general government revenue devoted to paying interest.
Transmission: the speed at which new financing conditions pass through to the average cost of the stock, depending on the share of the debt maturing and the gap between the market rate and the implicit rate.
For the same starting stock, in this accounting identity, two countries can differ in burden through only two terms: the average interest cost of their stock or the level of their revenue.
Cost and revenue
The cost does not follow the stock. In the European Union in 2025, the linear relationship between the starting stock and the implicit interest rate is practically nil (R² = 0.00): over one year and across countries, the level of debt does not predict its implicit interest rate, which does not mean it never has an effect on it. Italy, heavily indebted, pays an implicit rate close to that of countries with much lower debt, and France pays 2.02%, in line with the euro area average (2.2%).
Revenue matters too. At the same implicit interest rate, a government whose revenue represents a smaller share of GDP devotes a larger share of its revenue to interest. These are the two terms that separate the look-alike pairs: Hungary pays 5.53% on its stock against 2.01% for Slovenia, and its revenue amounts to 43% of GDP against 47%.
See the 27 countries: stock, cost, revenue and burden
The four dimensions, 2025 — Eurostat, general government, harmonised scope (strictly comparable)
Country
Euro area
Starting stock debt end-2024 / GDP 2025
Cost implicit interest rate
Revenue % of GDP
Burden interest / revenue
Greece
yes
147.0%
2.15%
50.0%
6.3%
Italy
yes
131.0%
2.94%
47.9%
8.0%
France
yes
110.5%
2.02%
52.2%
4.3%
Belgium
yes
100.3%
2.22%
49.0%
4.5%
Spain
yes
95.9%
2.49%
42.9%
5.6%
Portugal
yes
87.8%
2.20%
43.1%
4.5%
Finland
yes
80.7%
2.01%
53.7%
3.0%
Austria
yes
76.8%
2.09%
50.9%
3.2%
Hungary
no
68.8%
5.53%
42.6%
8.9%
Slovenia
yes
62.9%
2.01%
46.6%
2.7%
Cyprus
yes
59.8%
1.91%
43.6%
2.6%
Germany
yes
59.5%
1.84%
47.2%
2.3%
Slovakia
yes
56.8%
2.73%
43.5%
3.6%
Croatia
yes
53.0%
2.64%
47.1%
3.0%
Poland
no
51.4%
4.88%
43.6%
5.8%
Romania
no
50.3%
5.65%
35.4%
8.0%
Latvia
yes
43.7%
2.53%
43.6%
2.5%
Malta
yes
43.1%
2.82%
34.7%
3.5%
Netherlands
yes
41.9%
1.73%
43.6%
1.7%
Czechia
no
40.7%
3.20%
41.0%
3.2%
Ireland
yes
35.8%
1.38%
24.2%
2.0%
Lithuania
yes
35.6%
2.51%
39.4%
2.3%
Sweden
no
32.9%
1.84%
48.0%
1.3%
Denmark
no
28.7%
2.77%
50.1%
1.6%
Luxembourg
yes
25.3%
1.33%
47.1%
0.7%
Estonia
yes
22.3%
2.16%
43.2%
1.1%
Bulgaria
no
21.5%
3.82%
38.1%
2.2%
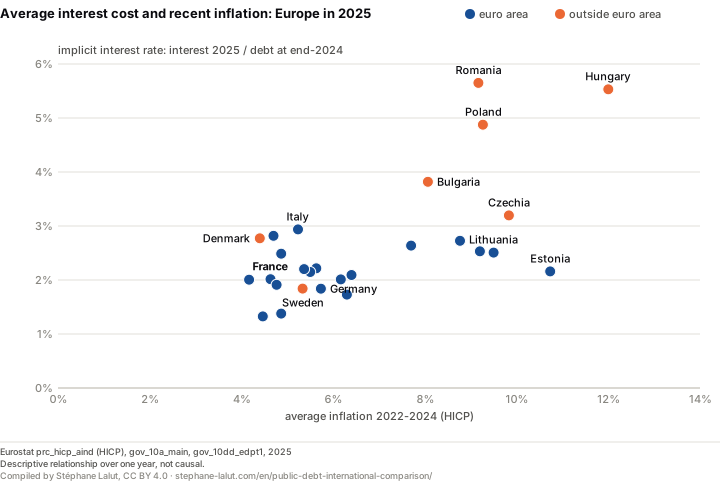
Average interest cost and recent inflation
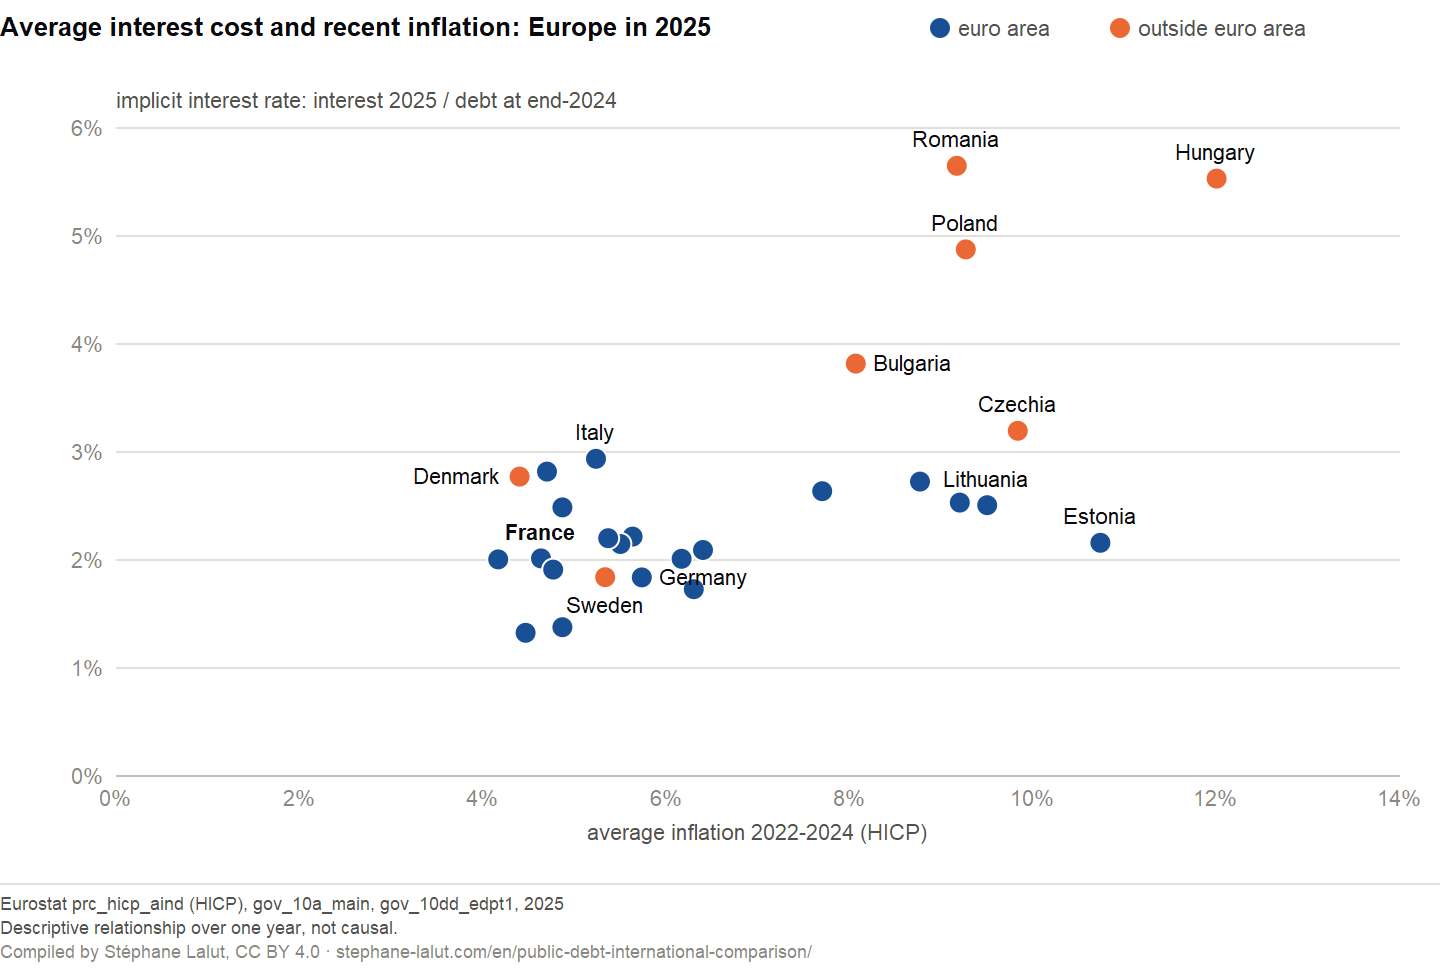
Implicit interest rate on the debt (2025) and average inflation over the previous three years (harmonised index of consumer prices, Eurostat). A descriptive relationship over one year.
Outside the euro area, the implicit interest rate is closely associated with recent inflation (R² = 0.61); within the euro area, much less so (R² = 0.13): the Baltic states experienced high inflation without paying much. Currency membership is not the whole story either: Sweden, outside the euro, pays 1.84%, like Germany. Over a single year and from one country to another, these data show that the level of a public debt is not enough to predict its average interest cost; they say neither that the euro makes it cheaper, nor the opposite.
The regression and its robustness
In a descriptive regression, average inflation over the previous three years and euro area membership together account for a large part of the observed dispersion (R² = 0.65). The coefficient associated with the euro area is −1.3 points, that associated with one additional point of average inflation +0.21 points. These coefficients do not measure causal effects, and the three-year window is a choice: with average inflation over two, four or five years, their sign does not change and their order of magnitude holds (from −1.1 to −1.3 points for the euro area, from +0.21 to +0.32 points per point of inflation, R² from 0.65 to 0.73).
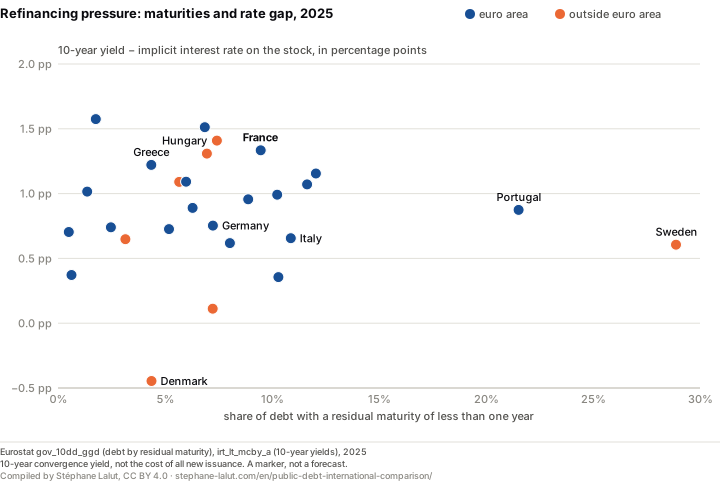
Transmission: a pressure gauge, not a forecast
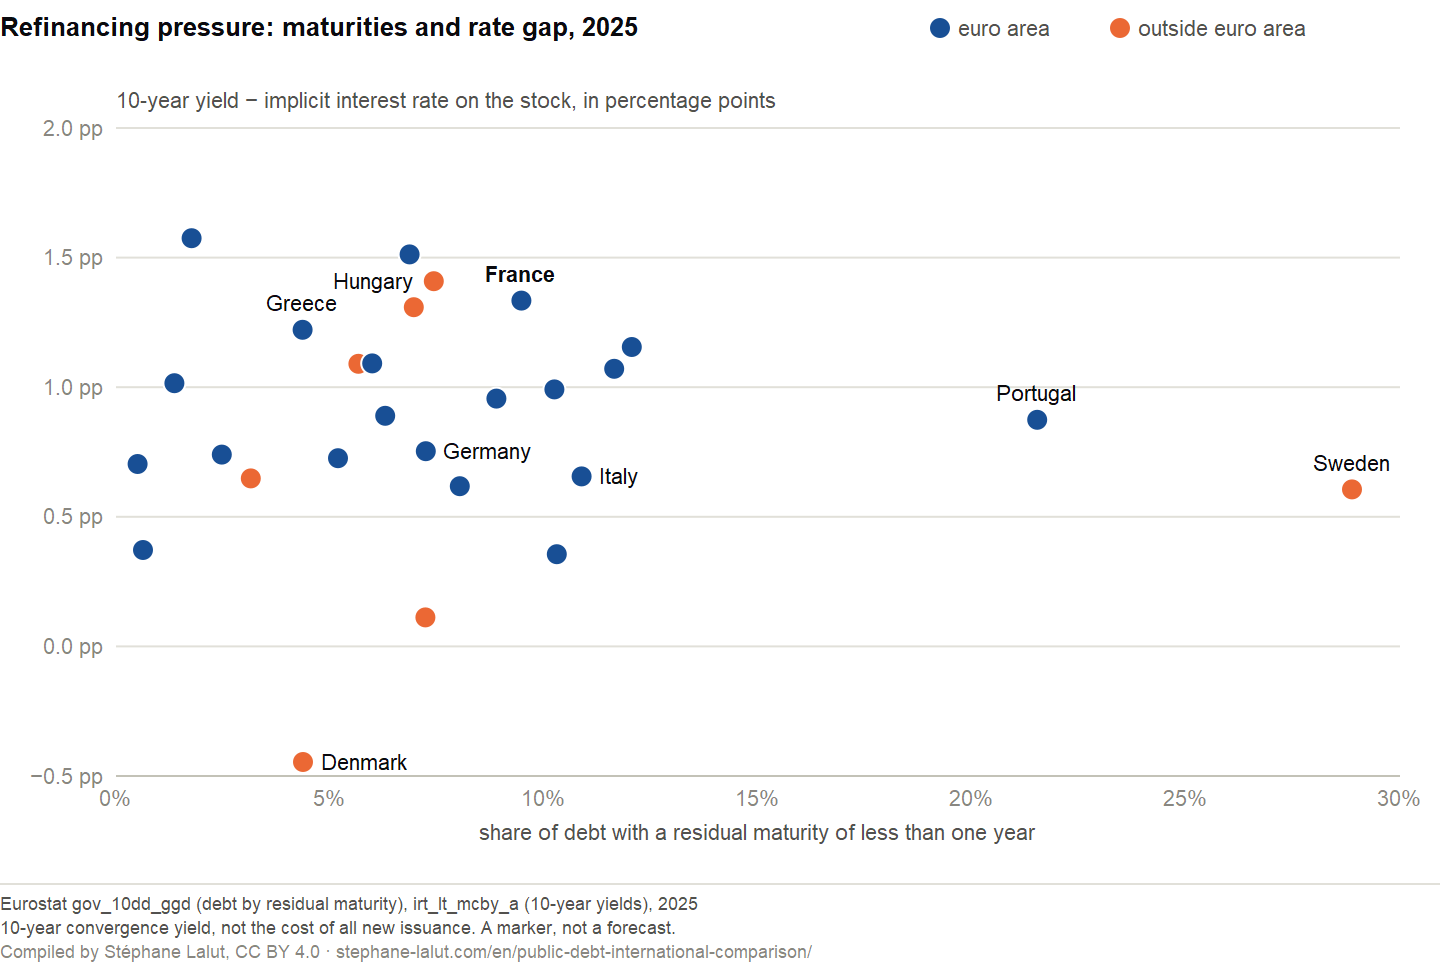
Share of the debt maturing within the year (Eurostat, debt by residual maturity) and gap between the harmonised 10-year yield and the implicit interest rate on the stock, 2025. A transmission gauge, not a forecast.
A given year’s implicit interest rate covers debt issued at different dates: it catches up with market conditions only as the debt is refinanced. Two indicators capture this inertia: the share of the debt maturing within the year, and the gap between the harmonised 10-year yield and the implicit rate. Neither is a forecast: a State does not borrow only at 10 years, and today’s yield is not tomorrow’s.
In France, 9.5% of the debt outstanding at the end of 2025 has a residual maturity of less than one year. In 2025, the harmonised 10-year yield (3.35%) was 1.33 percentage points above the implicit interest rate on the stock. If financing conditions remained above the cost of the debt being replaced, refinancing would put upward pressure on the average cost — the mechanism detailed on the page What does French public debt actually cost?. In Denmark, the gauge points the other way: the 10-year yield is below the implicit rate on the stock (−0.45 percentage points).
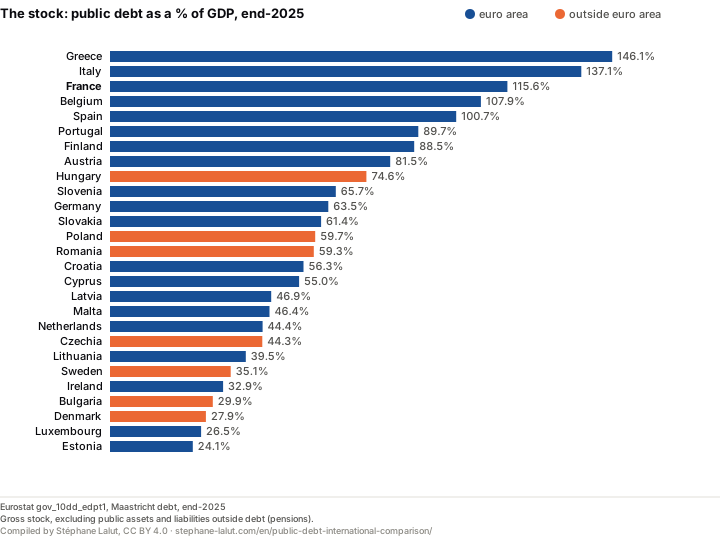
The stock: a ranking that does not tell the whole story
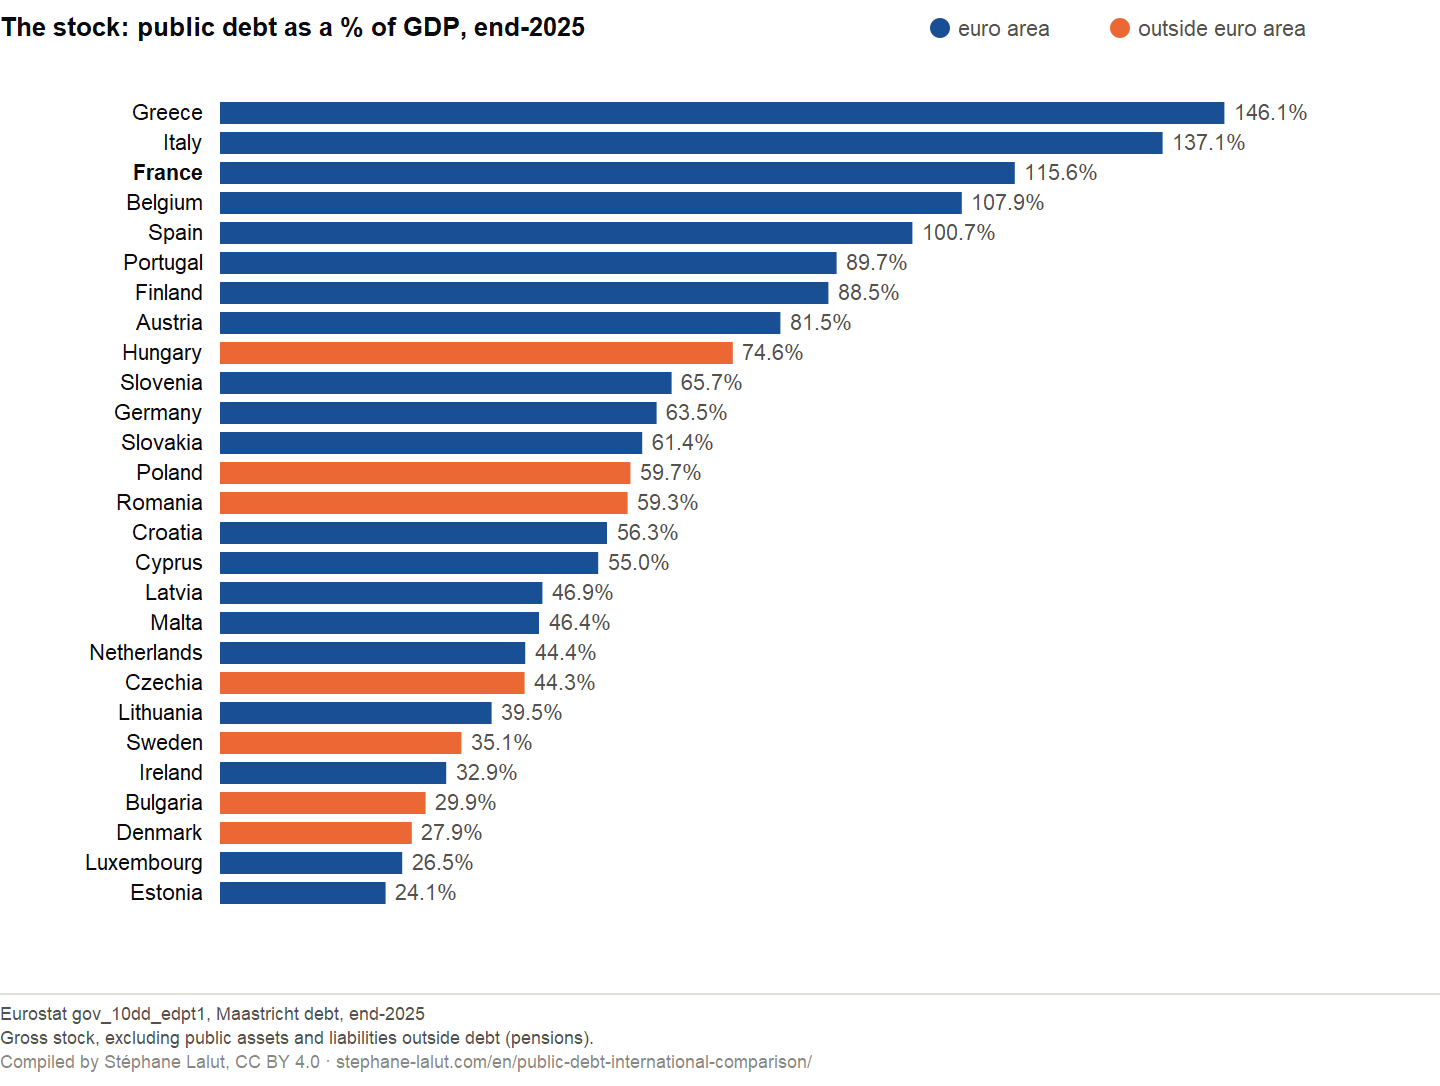
Closing stock: Eurostat, Maastricht gross debt of general government, end of 2025. In blue, the euro area; in orange, countries outside the euro area.
At the end of 2025, France has the third highest public debt in the European Union, at 115.6% of GDP. This is the ranking most comparisons use. It measures a gross stock, without public assets or commitments that are not debt, such as future pensions; and, as we have seen, it does not say what this debt costs.
And outside Europe?
Outside the European Union, the data are no longer harmonised. For advanced economies, the OECD (Economic Outlook) allows a similar calculation on a broader basis, gross financial liabilities rather than Maastricht debt; the ratio of interest to these liabilities is therefore not exactly the European implicit interest rate. France is included, on the same basis, as a benchmark. Three cases are particularly illustrative.
Japan
Gross financial liabilities
215% of GDP
Interest / liabilities
0.69%
Interest / revenue
3.9%
Switzerland
Gross financial liabilities
39% of GDP
Interest / liabilities
0.70%
Interest / revenue
0.8%
Net financial liabilities
−12% of GDP
United States
Gross financial liabilities
117% of GDP
Interest / liabilities
3.96%
Interest / revenue
14.7%
France (same basis, benchmark)
Gross financial liabilities
114% of GDP
Interest / liabilities
2.01%
Interest / revenue
4.4%
Japan’s gross financial liabilities are, relative to GDP, nearly twice France’s, but its interest-to-liabilities ratio is 0.69% against 2.01%, and it devotes less of its revenue to interest (3.9% against 4.4%). Switzerland, with its own currency, pays little on a small debt, and its financial assets exceed its liabilities. The United States, with liabilities close to France’s, devotes 3.3 times the French share of its revenue to interest.
See all advanced economies (OECD)
Advanced economies outside the European Union — OECD, Economic Outlook (comparable with reservations)
Country
Stock gross financial liabilities / GDP
Interest / gross financial liabilities
Burden interest / revenue
Net financial liabilities % of GDP
Caveat
United States
117.0%
3.96%
14.7%
98%
—
Japan
214.9%
0.69%
3.9%
88%
—
United Kingdom
96.6%
2.60%
6.0%
76%
—
Canada
103.6%
3.34%
8.1%
8%
—
Switzerland
38.8%
0.70%
0.8%
-12%
—
Norway
—
—
1.9%
—
gross financial liabilities published up to 2023 only: implicit interest rate not computed
France (OECD basis)
113.6%
2.01%
4.4%
78%
—
The major emerging economies: China, India, Brazil, South Africa (indicative data)
Only indicative measures exist: debt according to the IMF, and central-government interest payments only according to the World Bank, always taken in the same year. India devotes 34% of its central government revenue to interest, Brazil 30%, South Africa 18%, for debts of 85%, 87% and 76% of GDP according to the IMF, in 2022, 2024 and 2024, the latest years published by the World Bank. Part of the gap comes from the average interest cost, another from the relative weakness of revenue: without harmonised data, the two cannot be separated.
Large emerging economies — IMF and World Bank (indicative: different scopes and definitions)
Country
Stock gross debt / GDP (IMF), year
Burden interest / revenue (World Bank)
Caveat
China
72.1% (2021)
3.4%
IMF debt and World Bank interest for the same year; central-government interest payments only
India
84.6% (2022)
34.0%
IMF debt and World Bank interest for the same year; central-government interest payments only
Brazil
87.0% (2024)
30.1%
IMF debt and World Bank interest for the same year; central-government interest payments only
South Africa
76.0% (2024)
18.2%
IMF debt and World Bank interest for the same year; central-government interest payments only
What these data do not say
A single year. The relationships described concern 2025; they say nothing about their stability over time.
Correlations, not causes. A regression across 27 countries describes an association. Euro membership and past inflation are, moreover, linked to each other.
A gross stock. Maastricht debt does not deduct public assets; Switzerland, whose net financial liabilities are negative, shows how much this gap matters.
Similar definitions, not identical ones. Outside Europe, the OECD measures gross financial liabilities, the IMF gross debt, the World Bank central-government interest payments only.
The risk of a crisis. It also depends on growth, the primary balance, the currency, maturities and creditors: this page does not measure it.
The holders of the debt. Central bank, non-residents, domestic savers: their shares change the risk and the cost of a debt, and will be the subject of a separate analysis.
Commitments outside debt, such as future pensions, enter none of these figures.
Testing against research: what the literature does to this reading
Measured here. Over one year and across the 27 countries of the Union, the absence of a linear relationship between the starting stock and the implicit interest rate; thirty years of 10-year yield spreads against Germany. Calculations from official series that can be independently reproduced: none of the texts read measures the implicit rate in a cross-section.
Consistent with. In their cross-sectional charts, Gruber and Kamin find no apparent relationship between debt and long-term rates across 19 OECD countries; in bond issues from 1999 to 2005, the debt ratio no longer explains the yield spreads of euro members (Bernoth, von Hagen and Schuknecht). The page’s caveat also holds: estimated on variation within each country, projected debt raises long-term rates by a few basis points per point of GDP (Gruber and Kamin; Laubach, on expected US rates). On the euro, De Grauwe and Ji estimate that in 2010-2011 a large part of the rise in the spreads of peripheral countries is not explained by their fiscal fundamentals, a part that varies by country, Greece being the exception; Saka, Fuertes and Kalotychou, who put this hypothesis to the test, find that the significant contagion coming from Spain before the ECB’s announcement of 26 July 2012 disappears afterwards. From 1993 to 1997, the yields of all EU countries except Greece, including those outside the euro, converge towards German and US levels (Bernoth, von Hagen and Schuknecht).
Challenged by. Any reading of the absence of a cross-sectional link as an absence of effect: Gruber and Kamin attribute it to an omitted variable, the solvency that markets ascribe to each State; De Grauwe and Ji find in the euro area, after 2008, a significant and non-linear relationship; before 1999, the relative level of debt predicted the spread at issuance, afterwards it was the weight of debt service in revenue (Bernoth, von Hagen and Schuknecht). Hence the page’s wording: the level is not enough to predict the average interest cost. An overly broad reading of 2012: credit default swap premiums fall everywhere after the announcement, outside the euro included; the study establishes the end of contagion, not that all of the easing came from the ECB, and its authors interpret their results as supportive of its programme.
Not established. The link between the implicit interest rate and past inflation outside the euro: Gruber and Kamin relate long-term rates to projected inflation, not to current inflation. The euro’s own share in the convergence before 1999: Bernoth, von Hagen and Schuknecht compare bonds issued in the same currency, with no exchange-rate risk, and do not separate future members from countries that stayed outside.
References read
Gruber, J. and Kamin, S., “Fiscal Positions and Government Bond Yields in OECD Countries”, Federal Reserve, International Finance Discussion Paper 1011, 2010.
Bernoth, K., von Hagen, J. and Schuknecht, L., “Sovereign Risk Premiums in the European Government Bond Market”, revised version, May 2006 (published in the Journal of International Money and Finance, 31(5), 2012).
De Grauwe, P. and Ji, Y., “Self-Fulfilling Crises in the Eurozone: An Empirical Test”, CEPS Working Document no. 367, 2012 (published in the Journal of International Money and Finance, 34, 2013).
Saka, O., Fuertes, A.-M. and Kalotychou, E., “ECB Policy and Eurozone Fragility: Was De Grauwe Right?”, CEPS Working Document no. 397, 2014 (published in the Journal of International Money and Finance, 54, 2015).
Laubach, T., “New Evidence on the Interest Rate Effects of Budget Deficits and Debt”, Finance and Economics Discussion Series 2003-12, Federal Reserve (published, revised, in the Journal of the European Economic Association, 7(4), 2009).
Literature review checked on 30 September 2026: every reference cited was read in full on that date, in the version indicated.
Frequently asked questions
Is France more indebted than other countries?
More than most: at the end of 2025, its public debt stands at 115.6% of GDP, the third highest in the European Union after Greece and Italy (Eurostat, Maastricht debt). But the level of the debt does not say what it costs: in 2025, France devoted 4.3% of its public revenue to interest, less than 6 countries that are nonetheless less indebted (Romania, Poland, Hungary, Portugal, Spain, Belgium).
Does France pay more to service its debt than its neighbours?
Not systematically. In 2025, its implicit interest rate — the year's interest divided by debt at the end of 2024 — is 2.02%, close to the euro area average (2.2%): some countries pay less, notably Germany (1.84%), others more. The 10-year yield exceeds this implicit rate by 1.33 percentage points, and 9.5% of the debt matures within the year: if financing conditions remained above the cost of the debt being replaced, refinancing would push this average cost up.
Why don't two countries with similar debt ratios pay the same interest?
Because the burden depends on three terms: the debt stock, its average interest cost and the revenue available to service it. In 2025, Slovenia (63% of GDP) and Hungary (69%) have similar debts; yet the second devotes 3.3 times more of its revenue to interest: it pays 5.53% on its stock against 2.01%, and its revenue amounts to 43% of GDP against 47%.
Does the euro lower the cost of debt?
Not automatically. Before 1999, yield spreads against Germany narrowed sharply in the future euro countries, but also in Sweden, which never joined. In 2012, spreads widened sharply for the most vulnerable members (Greece was borrowing at 21.0 points above Germany), more than any country that stayed outside; the easing followed the ECB's interventions. In 2025, Sweden and Denmark borrow at 10 years more cheaply than Germany, France more expensively. On its debt stock, Sweden pays 1.84%, like Germany (1.84%). The euro removes exchange-rate risk between its members; it does not guarantee them the German rate.
Does high debt necessarily lead to a crisis?
These data do not make it possible to estimate the risk of a crisis. They show only that the same level of debt can correspond to very different current burdens. The risk of a crisis also depends on growth, the primary balance, the structure of creditors, the currency, maturities, public assets and financial conditions.
Europe (strictly comparable) — Eurostat, general government (S.13), national accounts ESA 2010, amounts in national currency: interest paid and revenue (gov_10a_main, D41PAY and TR), Maastricht debt (gov_10dd_edpt1), GDP (nama_10_gdp), debt by residual maturity (gov_10dd_ggd), 10-year yields (irt_lt_mcby_a), harmonised index of consumer prices (prc_hicp_aind).
Advanced economies outside the EU (with caveats) — OECD, Economic Outlook: gross interest, revenue, GDP and gross financial liabilities of general government.
Major emerging economies (indicative) — IMF, World Economic Outlook (general government gross debt); World Bank, World Development Indicators (interest as a % of central government revenue).
The calculations, statistics and figures are produced by a single script, re-run with each release of the sources; no figure on this page is entered by hand. Download the data (CC BY 4.0 licence): CSV, one row per country, readable in a spreadsheet; JSON, with the statistics and definitions. Method: the burden, the stock and the implicit interest rate satisfy the exact identity given above, using debt at the end of the previous year (the ECB’s implicit interest rate convention, distinct from Eurostat’s “apparent cost”, based on average debt); the robustness of the coefficients is recalculated at each update over inflation windows of two to five years; the statistics are simple, descriptive least squares.
Reusing this page
The charts, the data and a ready-made citation, under an open licence. Each chart carries its source, vintage and reading caveat inside the image: reused in a lecture or an article, it does not come apart from what makes it readable.
Same debt, different burden: the 27 EU countries in 2025
With similar debt, the share of revenue spent on interest can differ by a factor of 3.3; outside the euro area, it rises faster with debt.
Reading caveat. Dotted lines: look-alike pairs (nearest neighbour by debt stock, gap under 10 percentage points, three largest gaps in burden).
Eurostat gov_10a_main (D41PAY, TR), gov_10dd_edpt1 (GD), nama_10_gdp (B1GQ), 2025; general government S.13, national currency
Average interest cost and recent inflation: Europe in 2025
Outside the euro area, the implicit interest rate is closely associated with recent inflation; within the euro area, much less so. Sweden, outside the euro, pays about the same as Germany.
Reading caveat. Descriptive relationship over one year, not causal.
Refinancing pressure: maturities and rate gap, 2025
The share of debt falling due and the gap between market yields and the implicit interest rate: a marker of pressure on the average cost, not a forecast.
Reading caveat. 10-year convergence yield, not the cost of all new issuance. A marker, not a forecast.
Eurostat gov_10dd_ggd (debt by residual maturity), irt_lt_mcby_a (10-year yields), 2025
Lalut, Stéphane (2026). “Public debt: why 100% of GDP does not carry the same burden everywhere”. Eurostat, OECD, IMF and World Bank data, retrieved September 30, 2026. https://stephane-lalut.com/en/public-debt-international-comparison/
In three sentences
This page compares what a public debt represents through four measures: the stock, its average interest cost, the revenue that services it and the speed at which new rates pass through. In the European Union in 2025, two countries with similar debt can devote shares of their revenue to interest ranging from 1 to 3.3, and the implicit interest rate has no linear relationship with the level of debt. These relationships describe one year and associations, not causes; they do not measure the risk of a crisis.
The data
The 27 European Union countries and the economies outside Europe, with their levels of comparability, their definitions and their statistics; the same content is available as CSV, one row per country, readable in a spreadsheet.
Data and charts CC BY 4.0 — free reuse, including commercial, with attribution. Text under copyright — short quotation free, full reproduction on request. The raw series belong to their producers (Eurostat, OECD, IMF and World Bank), under their own terms.