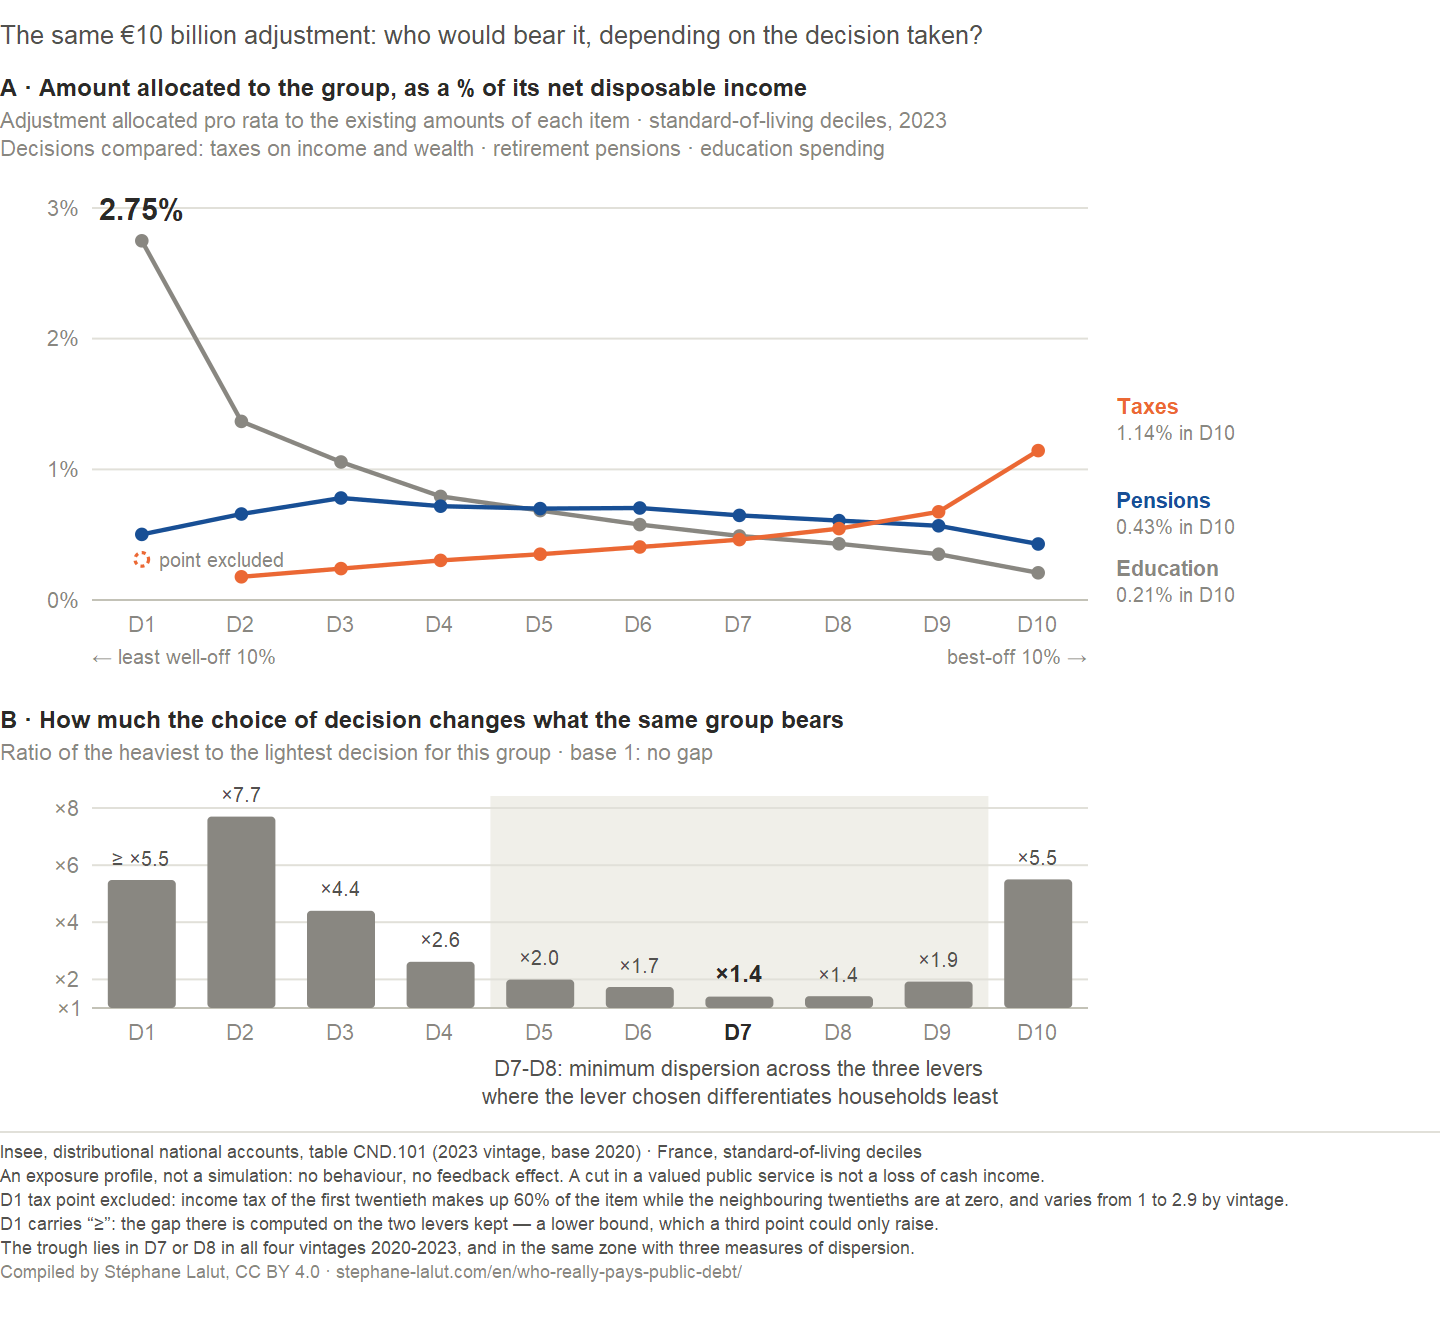
The same €10 billion adjustment does not fall on the same households depending on the decision taken: through education, it weighs mostly on the least well-off; through taxes, on the best-off. Who pays for public debt depends on what it finances, how it is financed and the adjustments chosen to service it.
The question arises in every indebted country. France is a useful case study for it: its statistical office, INSEE, publishes distributional national accounts that allocate taxes, contributions and public transfers across the income scale, which makes it possible to ask not only how much the debt costs, but how a given adjustment would be distributed across households.
Who pays for public debt? Before it becomes a technical question, it is experienced in concrete terms: the tax that goes up, public services that are cut back, the savings that inflation erodes. Asking who bears the costs, who receives the income and who decides is a sound discipline, provided the answer is not fixed in advance. What can be defended first is a three-part answer: there is no single payer of the debt; holding debt is not paying for it; and how its cost is distributed depends on the decision taken to adjust it. That some configurations shift costs onto groups less able to avoid them remains, further down, a hypothesis to be tested.
This page examines these configurations one by one: what makes them plausible, what would weaken them, and what the available data do not allow us to attribute. The size of the bill — stock, interest burden, average cost of the stock — is measured in another part of this dossier, What does French public debt actually cost?
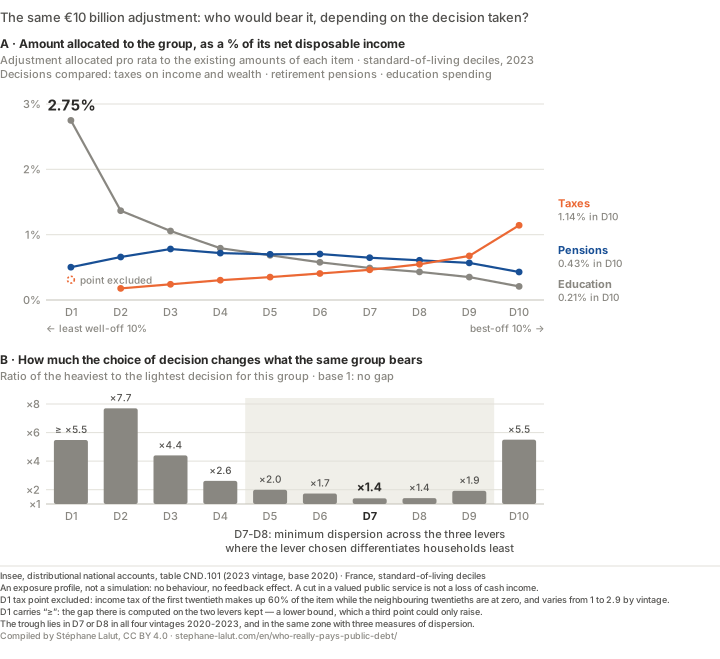
Depending on the decision, the adjustment does not fall on the same households
As long as no decision is named, the question “who pays?” has no answer. Once one is named, it becomes measurable: what would the distribution of the same adjustment look like, depending on the budget item it passes through?
The exercise that follows takes 10 billion euros and distributes them three times — through a rise in taxes on income and wealth, through a cut in retirement pensions, through a cut in education spending —, each time in proportion to the amounts each decile already pays or receives, then relates the result to its income. It is not a forecast: neither behaviour nor feedback effects enter it. It is the current structure of these items, made comparable from one decision to another.
INSEE, distributional national accounts, table CND.101 (standard-of-living twentiles, 2020-2023, base 2020); 2023 vintage. An accounting exposure profile, not a simulation.
The ranking reverses from one decision to another. A cut in education spending would represent 2.75% of the income of the poorest 10% and 0.21% of that of the richest; a rise in taxes on income and wealth, the opposite, up to 1.14% for the top decile. This is not a denominator effect: in absolute terms, the less well-off half would bear 57.8% of the cut in education spending, against 14.6% of the tax increase. A cut in pensions, for its part, stays within a narrow band — from 0.43 to 0.78% — and spares no group in particular.
The result in one sentence. “Who pays for the debt?” has no answer in itself; it has one per decision: the same adjustment weighs mostly on the least well-off if it passes through education, mostly on the best-off if it passes through taxes.
The second panel carries the least expected result. For the richest 10%, the heaviest decision weighs 5.5 times the lightest, and at least as much for the poorest 10%: at both ends of the scale, the choice of instrument decides almost everything. In the middle, that ratio falls to 1.4. It is in D7-D8 that the lever chosen makes the least difference between households. This does not mean that these deciles would bear less of the adjustment: only that, in this exercise, changing the lever alters their exposure less than at the ends of the scale. This trough depends neither on the year — it lies in D7 or D8 across the four vintages 2020-2023 published by INSEE — nor on how the gap is measured: the coefficient of variation and the range relative to the mean place it in the same zone.
The three limits of this exercise
Three limits frame this reading. A public service valued in euros is not income: education spending imputed to a household is not paid to it, and cutting it would not cost the household exactly that sum. The three decisions are proportional by construction; a targeted measure — on some pensions, on some taxes — would draw other curves, so the figure says nothing about “taxes” or “public spending” in general. Finally, the adjustment is related to disposable income; another denominator would move the crossing points without making these contrasts disappear.
Four roles not to be confused
The debate often mixes up four roles. The borrower is the public body that issues the debt — first the State, then social security and local authorities. The creditor advances the funds and receives interest in return. The beneficiary benefits from what the borrowing financed: a road, a school, income support during a crisis. Whoever bears a cost suffers, relative to the alternative considered, a loss of income, wealth or services linked to financing or adjustment choices: the taxpayer who pays an additional tax, the user of a service whose resources tighten, the saver whose investment is eroded by inflation.
The same person often holds several of these roles: they pay taxes, are treated in a public hospital and hold State securities through French assurance-vie savings policies (life-insurance-based savings). The groups examined below therefore overlap; they do not share out the debt like slices of a cake.
One question remains that every answer must name: “who pays” — compared with what other decision? Borrowing less would have meant raising a tax, giving up a spending item or postponing it. Attributing a loss requires saying which alternative it is being compared with.
What the data make visible
Three things can be measured: who borrows, who holds the securities, and who contributes or receives today.
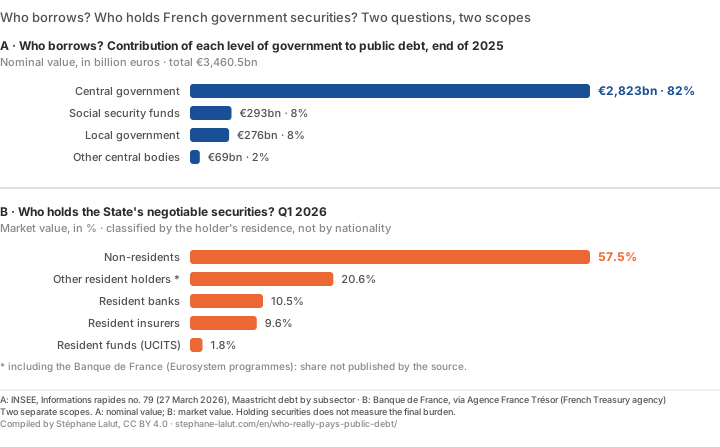
Two distinct scopes: A at nominal value (INSEE), B at market value (Banque de France, via Agence France Trésor). The values come from the same register as the figure on p. 101 of the book.
Who borrows, who holds. Central government accounts for most of the public debt: 2,823 billion euros out of 3,460.5, or 82% (end of 2025). Its negotiable securities are held, in the first quarter of 2026, 57.5% by non-residents; resident banks, insurers and funds together hold 21.9%; the other resident holders, 20.6%, include the Banque de France, whose share the source does not publish. The two panels cannot be combined: the first is at nominal value, the second at market value, and neither says who bears the burden.
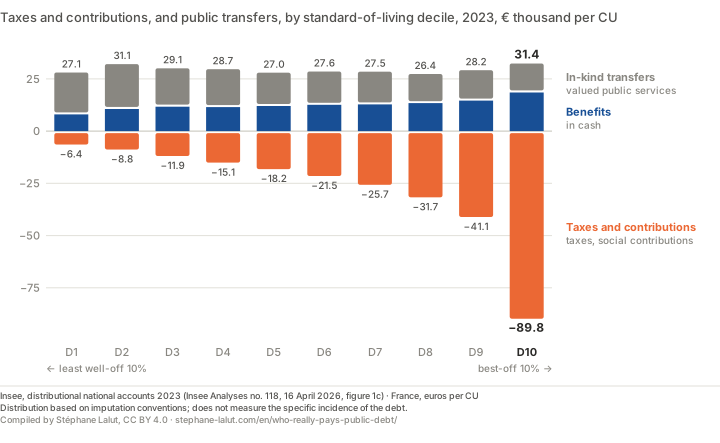
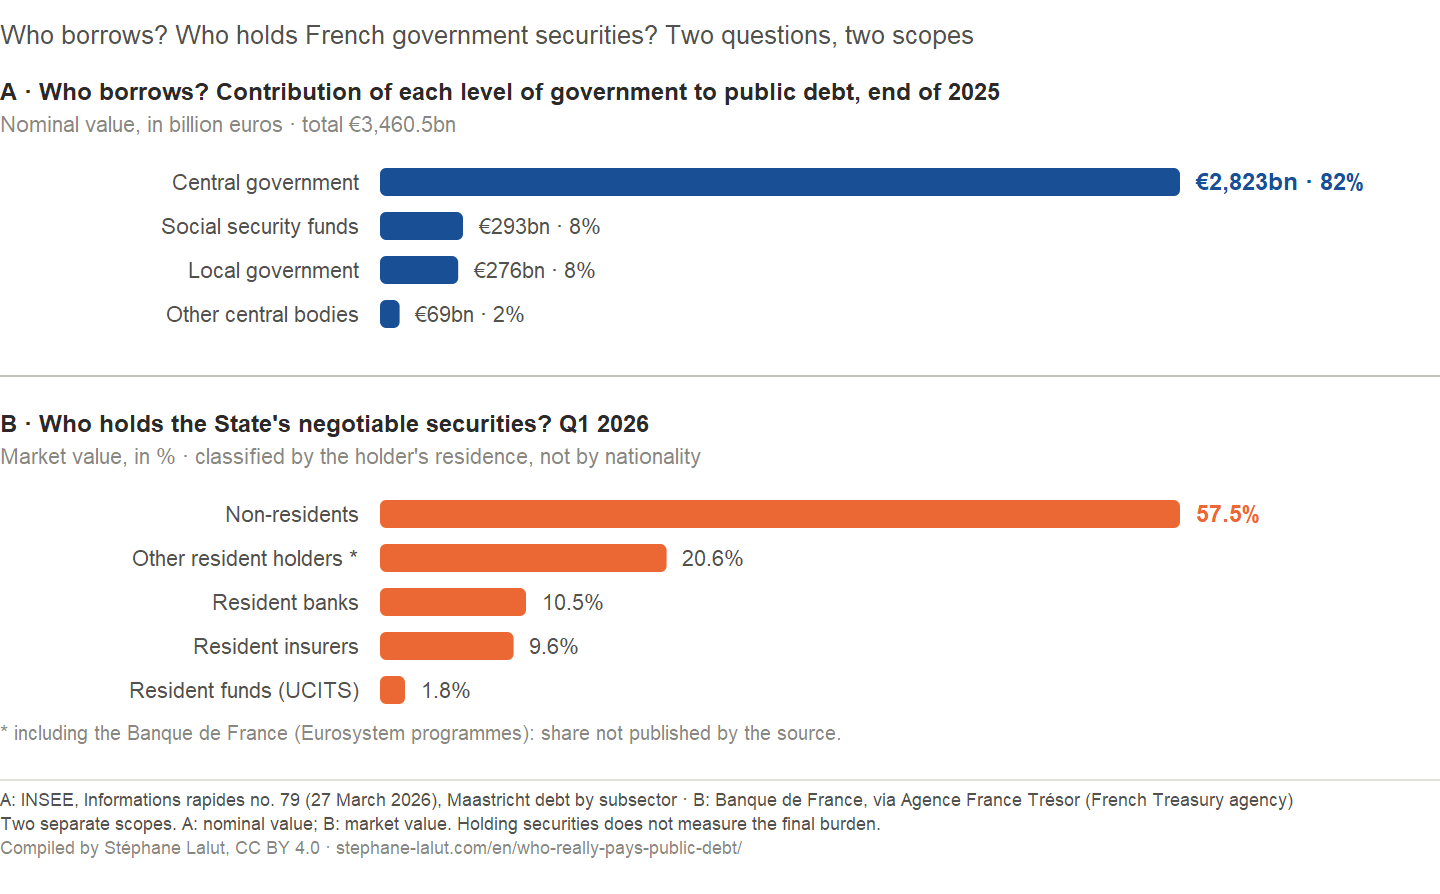
INSEE, distributional national accounts 2023 (Insee Analyses no. 118, 16 April 2026, figure 1c), in euros per consumption unit.
The values as a table (euros per consumption unit, 2023)
Decile
Taxes and contributions
Cash benefits
In-kind transfers
D1
−6,400
8,000
19,100
D2
−8,800
10,600
20,500
D3
−11,900
11,700
17,400
D4
−15,100
11,500
17,200
D5
−18,200
12,000
15,000
D6
−21,500
12,600
15,000
D7
−25,700
12,800
14,700
D8
−31,700
13,400
13,000
D9
−41,100
14,600
13,600
D10
−89,800
18,500
12,900
All
−27,000
12,600
15,800
Who contributes, who receives today. INSEE’s distributional national accounts allocate, for 2023, taxes, contributions and public transfers across standard-of-living deciles — the population ranked from the least to the most well-off, then cut into ten groups of equal size. Amounts are expressed per consumption unit (CU), the unit that makes households of different sizes comparable: a single person counts as 1 CU, a couple with two children under 14 as 2.1.
Taxes and contributions range from €6,400 per CU for the poorest 10% to €89,800 for the richest 10%, about 14 times more. Transfers received — cash benefits and public services valued in euros — vary much less: from one end of the scale to the other, they stay between €26,400 and €31,400, with no regular progression. It is this contrast, and this contrast alone, that the figure establishes: what is paid tracks the standard of living, what is received much less so.
Where the debt enters these accounts. In 2023, public transfers attributed to households — cash benefits and public services valued in euros — exceed taxes and contributions by 66 billion euros within this accounting framework, and INSEE links this balance to public borrowing. This does not mean that the beneficiaries of redistribution “created” this debt, nor that their position says who will repay it: it is the part of the year’s extended income that is not financed by the same year’s taxes and contributions.
The gap financed by borrowing, and how INSEE allocates it
That same year, transfers attributed to households exceeded taxes and contributions: €1,400 per CU on average, or 66 billion euros, financed by borrowing. This total covers the scope of these distributional accounts, which is not that of the public deficit: the two amounts are not substitutes for each other. In this accounting construction, the gap raises households’ extended standard of living for the year — a present benefit, financed on credit. It is not, for all that, 66 billion euros of identifiable payments: it is a balance allocated by imputation convention. To compute a standard of living “net of borrowing”, INSEE allocates this gap by convention — half as lower taxes and contributions, half as additional transfers; the figures on this page show current transfers, before that adjustment. These accounts describe who contributes and who receives today; they do not say who will pay tomorrow the debt that finances the gap.
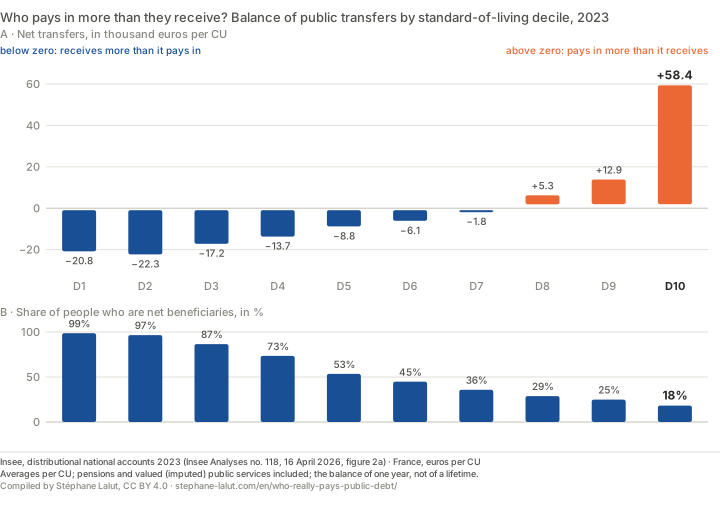
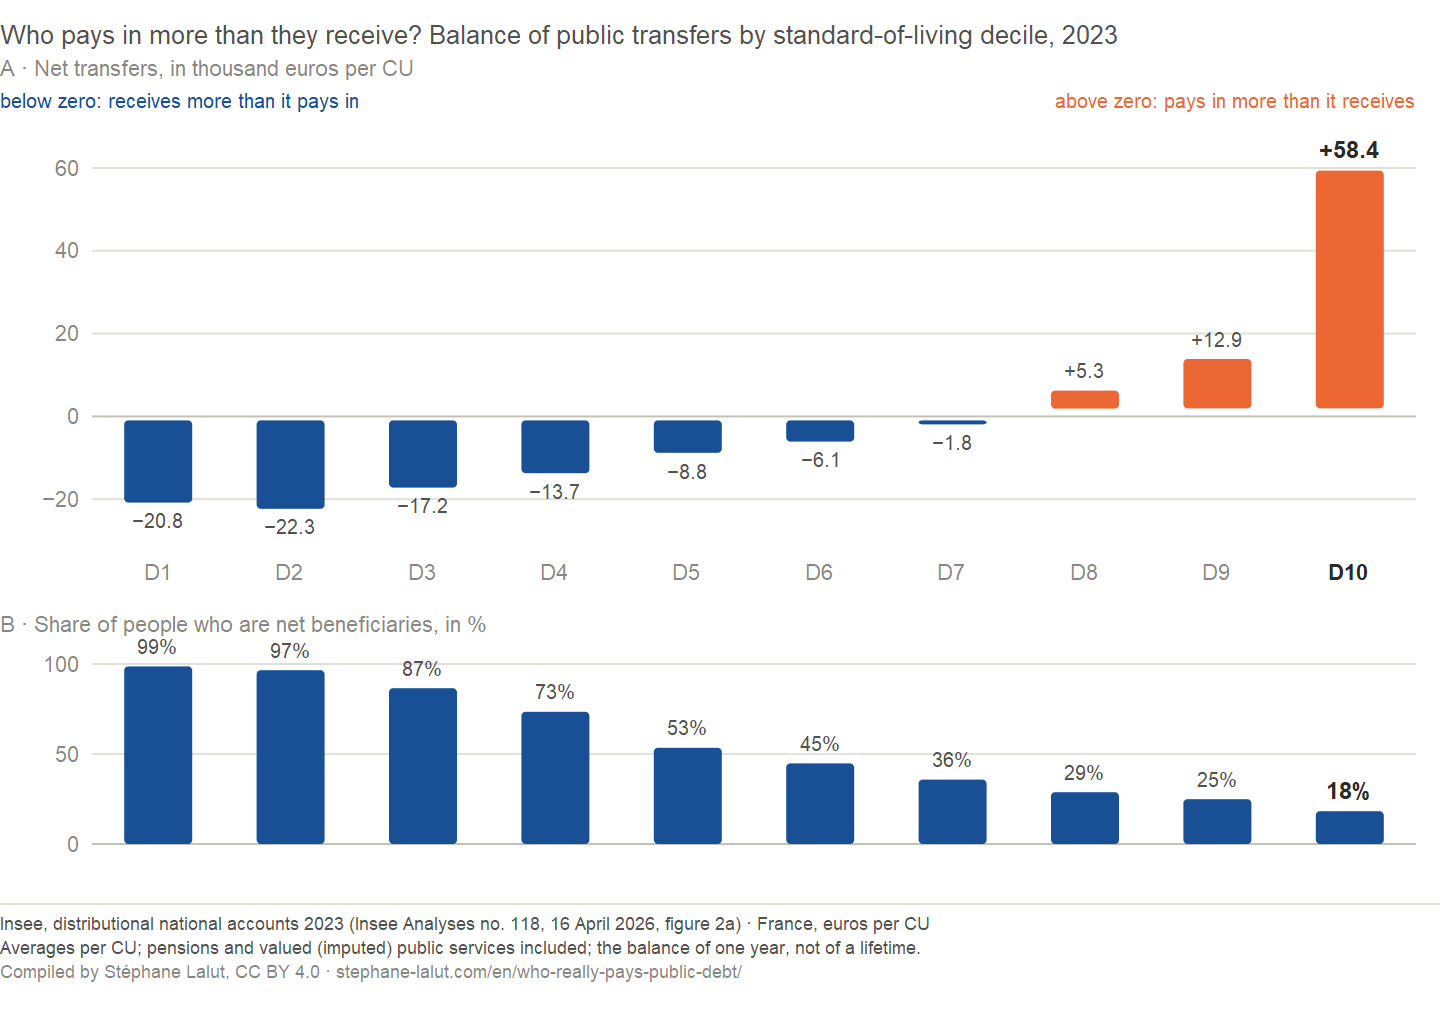
INSEE, distributional national accounts 2023 (figure 2a). Two units, two panels: euros per consumption unit, then share of people.
Who pays in net, who receives net. On average per CU, the balance tips at decile D8: in each of the first 7 deciles, transfers received exceed taxes and contributions — by €20,800 per CU in the first —, in the top three it is the opposite, and in the highest decile the average net contribution reaches €58,400 per CU.
Measured by people, the picture changes. 56% are net beneficiaries that year, 99% in the first decile and 18% in the highest. But net beneficiaries are a majority only in the first 5 deciles: in decile D7, a net beneficiary on average, they are only 36%. A group can receive more than it pays on average while most of its members pay more than they receive: a few very positive balances are enough to carry the average.
The link with the exercise at the top of the page is direct. The middle deciles are those where the average balance says “net beneficiary” while most of their members pay more than they receive — and they are the ones whose exposure varies least with the lever. Receiving more than one pays therefore offers no protection from an adjustment: position in today’s redistribution and exposure to tomorrow’s decision are two distinct rankings, and they do not coincide.
The conventions of these accounts: one year, imputed services
Several conventions frame this reading. It is the balance of one year, not of a lifetime: retirement pensions are counted as current benefits. Transfers include public services — healthcare, education, collective services — valued in euros and allocated by statistical imputation, not a record of the services each person used; the share of net beneficiaries depends on this at the margin. Income “before transfers” is a step in the calculation, not the income each person would have in an economy without taxes or public services. And this balance describes redistribution as a whole, not the specific effect of the debt.
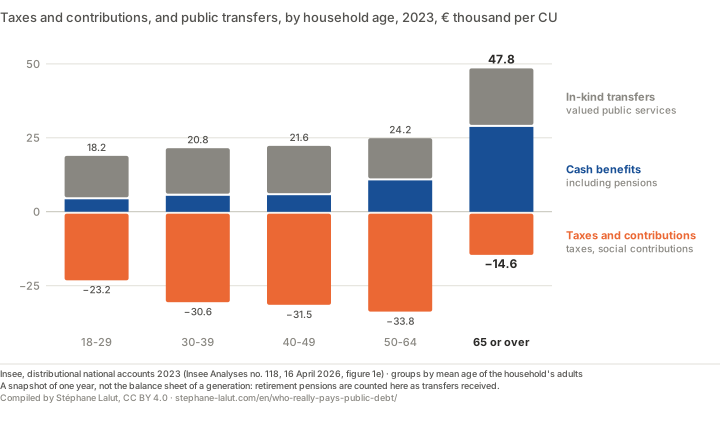
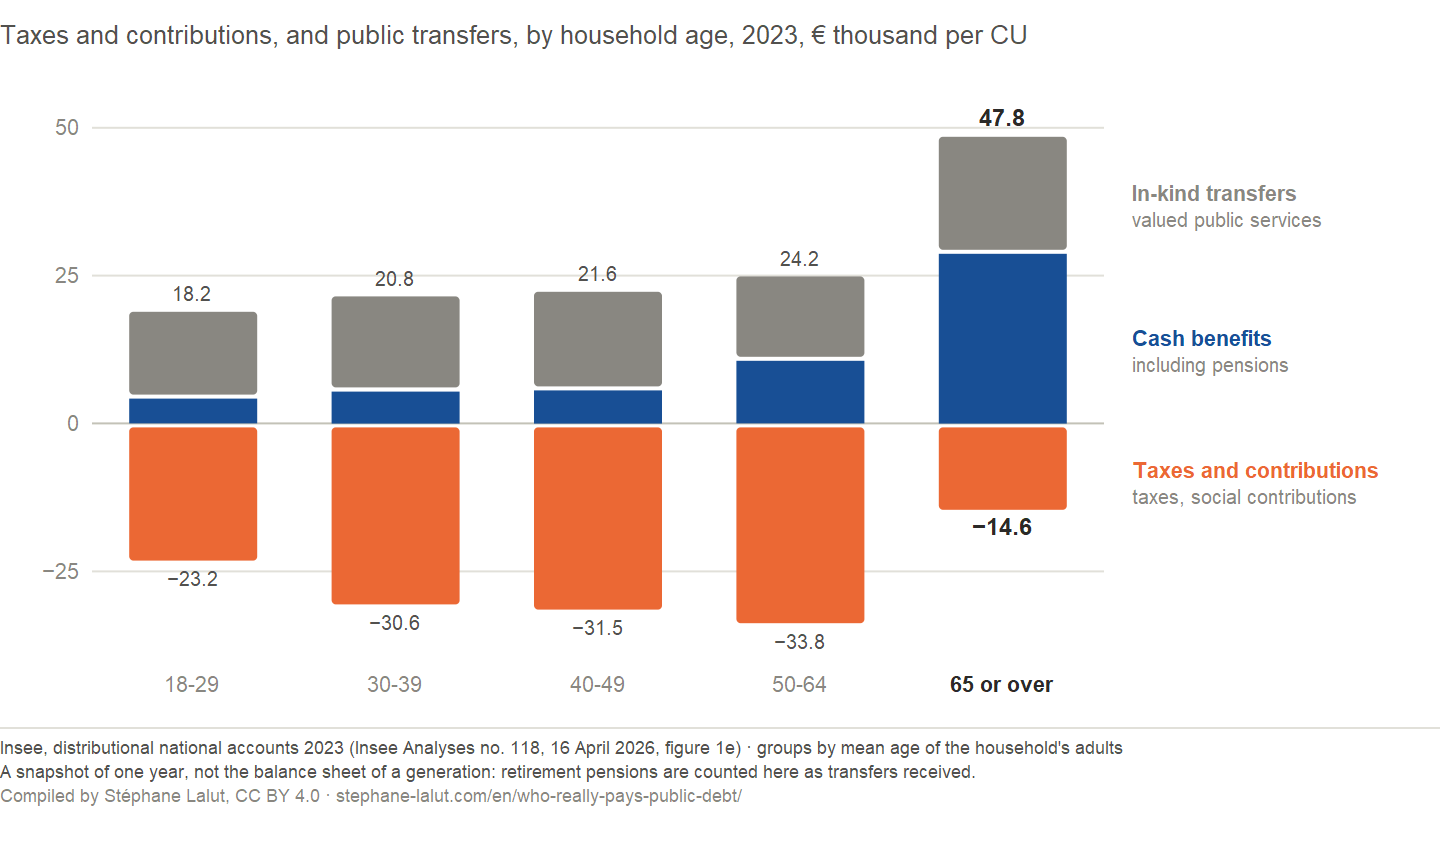
By household age: what each group pays and receivesINSEE, distributional national accounts 2023 (figure 1e). Groups by average age of the adults in the household.
By age. In 2023, under these conventions, households whose adults are on average 65 or over receive €47,800 per consumption unit in transfers — of which €28,700 in cash benefits, pensions included — and pay €14,600 in taxes and contributions, against €33,800 for households aged 50 to 64.Three limits of the reading by age
Three limits frame it. Pensions correspond in particular to rights acquired over a working life; here they are counted as current benefits, and a lifetime picture would not look like that of a single year. The household’s age is not the retirement status of each of its members, and a high amount of imputed healthcare also reflects greater needs, not a welfare advantage. Finally, this current snapshot is not a measure of the position of future generations: it identifies no payer of tomorrow.
Through which channels the burden can be distributed
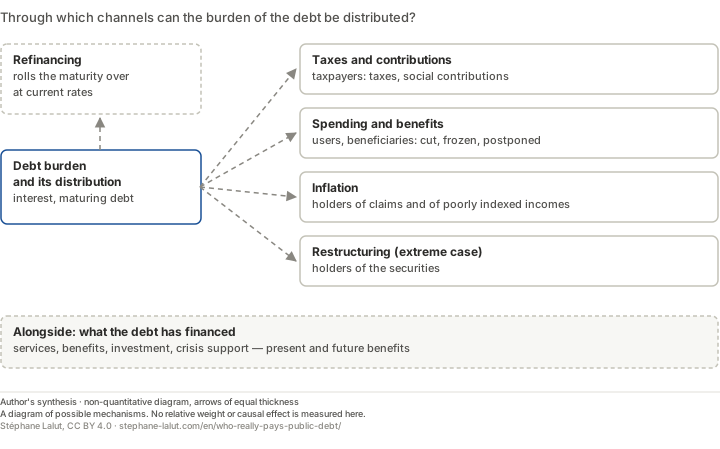
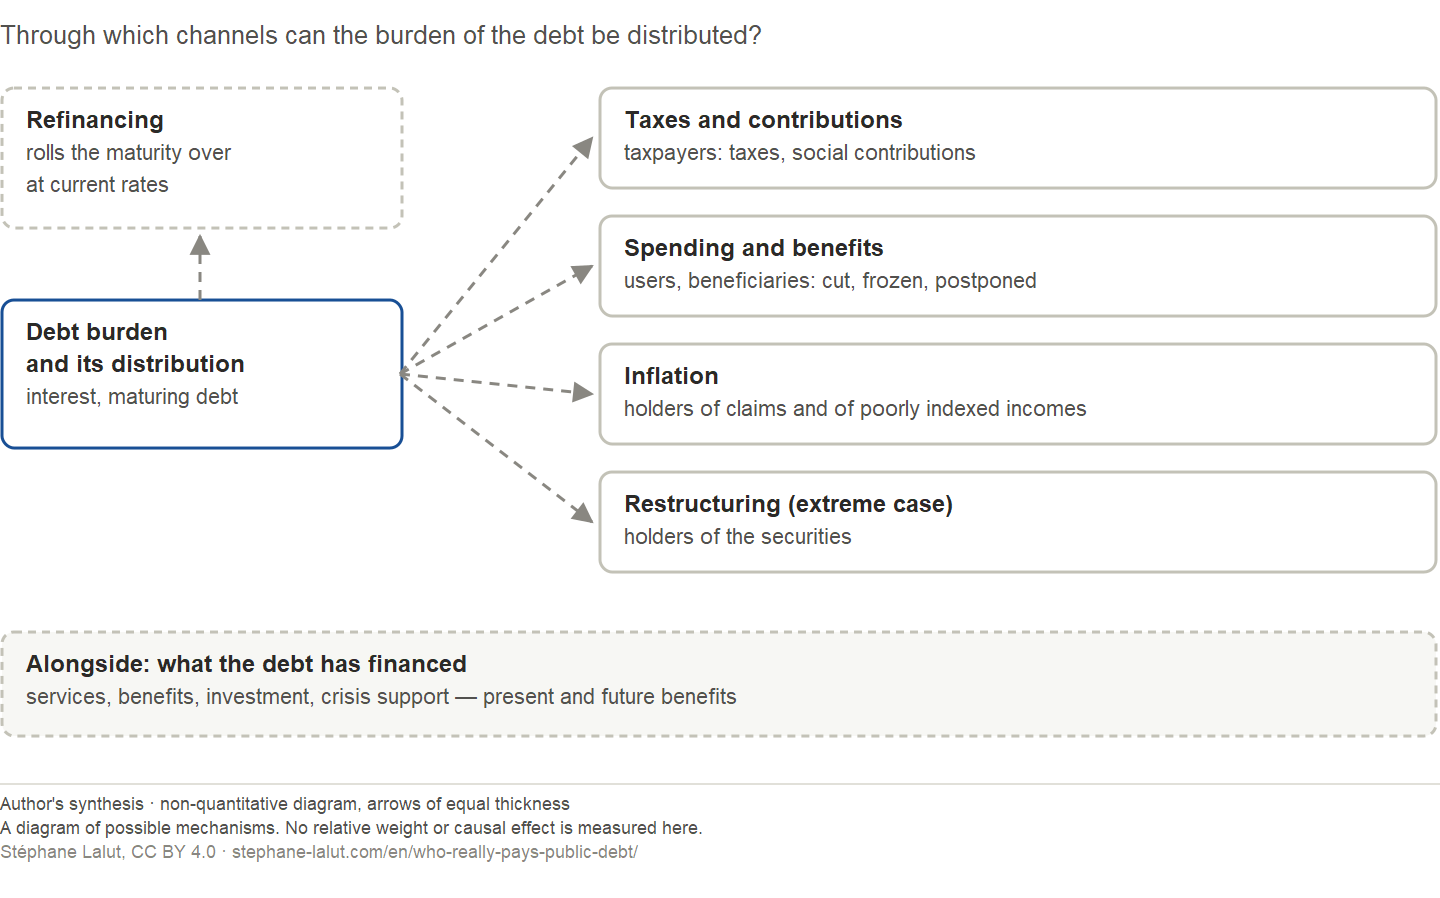
Four mechanisms can change the burden of the debt and how it is distributed, and they combine:
taxes and contributions — additional taxes and contributions, or tax cuts that are forgone;
spending and benefits — what is cut, frozen or postponed to free up room;
inflation, and more precisely the part of inflation not anticipated when a security’s rate was set: what was expected at that date tends to be already built into the rate required at issuance, and then transfers nothing. It is the gap between realised inflation and that expectation that reduces the real value of nominal claims already issued, and shifts part of the burden onto their holders and onto poorly indexed incomes. Two mechanisms work in the opposite direction: the cost of index-linked securities rises with prices, and refinancing takes place at the new rates. The net effect therefore depends on the indexed share, on the refinancing calendar and on what was anticipated — and France does not choose its inflation on its own. Not to be confused with the effect of inflation on the debt ratio, which runs through nominal GDP and does not, for its part, designate any loser;
restructuring, the extreme case: the first-round loss is imposed on the holders of the securities. Where it stops is another question — a bank, an insurer or a fund passes it on to its shareholders, policyholders or savers, and the State may have to step in. Here as elsewhere, the holder is not necessarily the one who bears the cost.
The list is not exhaustive: growth, asset income or sales and financing conditions also play a part — an asset sale finances a payment by reducing wealth, growth improves the ratio without levying anything on any group —, and history also provides examples of financial repression, which constrains returns. Refinancing, for its part, renews a maturity on the terms of the day: it can lighten or increase the burden, and on its own it does not identify who will bear it. And against these costs stands what the debt financed: the benefits, present and future, of public spending belong in the balance sheet just as much as the burden.
A diagram of possible mechanisms: no relative weight or causal effect is measured in it.
Debt converts present spending into future obligations. Those who come later therefore inherit these obligations without having taken part in the decision that created them. But they also inherit what that spending financed — infrastructure, education, research, public assets — and part of the securities themselves, which their parents hold directly or through assurance-vie: the burden and the claim pass through the same estate. The burden and the claim do not necessarily offset each other: some models also identify a channel through which productive capital is crowded out, when public securities take its place in people’s wealth — a channel this page does not measure for France. The net transfer therefore depends on the use, but not on the use alone: the absence of any lasting benefit enters the balance sheet, and the net cost also depends on the financing, the claims passed on and the alternative chosen; an investment they will benefit from can pass on more than it costs.
Net debt, public assets and the objection "we owe it to ourselves"
The stock is not enough to settle the matter, and net debt does no better: the measure INSEE publishes deducts only certain financial assets — cash, loans, securities —, not roads, human capital or the environment. Whatever the borrowing finances, one point remains: the decision is taken without those who will bear part of it. The objection “we owe it to ourselves” and its answer are developed on the page Is public debt a burden on future generations? (in French).
Less mobile groups — a hypothesis to be tested
Not all taxpayers are equal in the face of an adjustment. Households and firms that can move their income, their wealth or their activity escape a levy more easily than employees, pensioners or users who depend on a local public service. Hence the hypothesis: when the adjustment follows the line of least resistance, it may weigh more on those who cannot leave. To be testable, it must set its measures before observing the adjustment: for a given adjustment and comparable initial situations, a lower capacity for avoidance should go with a higher effort. And capacity for avoidance is not a single variable: geographical mobility, mobility of the tax base and the ability to replace a public service are three different properties.
How to test this hypothesis
To test it, these groups must be defined independently of the result, the adjustment studied must be specified — a given tax reform, a given benefit freeze — and a measure of effort chosen. It would be weakened by an adjustment falling mainly on other groups, or by compensation granted to the losers identified; such cases cannot be reread after the fact as confirmations. The territorial channel — the State shifting part of its constraint onto local authorities — is examined on the page Public debt: why are local authorities the adjustment variable? (in French).
Creditors — financing is not gaining
“Who holds the debt?” is the most frequently asked question, and it does not say who pays. The creditor advanced the funds: interest compensates the lender for providing the funds, for time and for risk. Its real return takes into account the interest, the change in the security’s value and inflation; its advantage over another investment is measured separately, at comparable horizon and risk. Both vary with the purchase date and the type of security. Holdings tell us where the interest goes, not who finances it.
What the breakdown of holders measures, and what it does not
For the State’s negotiable securities, the breakdown of holders is published by the Banque de France, via Agence France Trésor, at market value. It classifies holders by residence, not nationality: a “non-resident” may be a foreign fund managing the savings of French households, and a French household may hold State securities without knowing it, through its assurance-vie policy. Nor does a share of the stock held outside France measure the share of interest paid outside France: an end-of-period snapshot does not give an annual flow.
Investments with deferred benefits — a mechanism to be established case by case
A budget constrained by debt service may create an incentive to postpone spending whose benefits accrue only in the longer term, especially when postponing it carries little immediate political or budgetary cost: research, maintenance of public assets, training, the ecological transition.Why this mechanism must be established case by case
This is a class, not a special case — the ecological example has nothing singular about it; it is simply the one where the gap between the spending and its benefit is longest. The mechanism is plausible; it remains to be established project by project: which spending was postponed, by which decision, for which budgetary reason. Aggregates are not enough: total public investment is not climate investment, and the “environmental protection” function of the public accounts does not cover the whole transition. None of them measures an investment prevented by interest payments. Where the mechanism is established, it doubles the transfer: to the financial obligations passed on is added the foregone benefit — assets left unmaintained, a delayed transition —, and that second transfer appears in no debt stock.
The objections that matter
Debt also finances present benefits. Services, benefits and investments financed on credit benefit households today; an analysis that counts only the costs describes only half of the balance sheet.
We partly owe it to ourselves. Part of the securities is held, directly or not, by resident households: the interest they receive is also income. It remains to be seen who, among residents, receives this interest and who finances it.
Borrowing less would also have had a cost. A heavier tax or a spending item abandoned earlier would have had their own losers; the honest comparison is with these alternatives, not with a world without costs.
As long as nominal growth exceeds the implicit interest rate, the debt ratio can stabilise. The argument is serious and has often been true: under that condition, the debt ratio can remain stable even with a deficit excluding interest, provided that primary deficit stays below a threshold that depends on the gap between the two rates and on the level of the debt. Beyond it, the ratio rises regardless. And even when stable, a debt has to be serviced every year: the question of distribution remains.
What these data do not allow us to establish
No statistic says, on its own, who ultimately bears the burden of French debt: the final incidence of a euro of interest depends on the adjustments chosen year after year, and on the alternative they are compared with. A current distribution of taxes and benefits describes who contributes and who receives today; it does not identify the future payers of the debt. An average per consumption unit is not an individual bill: it is compatible with considerable dispersion, and a person who receives many benefits can lose from a specific reform.
What can be established is the effect of a specific decision — a reform, a freeze, a postponement — on groups defined in advance. It is at that level that the question “who pays?” receives verifiable answers.
Testing against research: what the literature does to this reading
Measured here. An accounting profile: the same €10 billion adjustment distributed in proportion to what each decile already pays or receives, according to INSEE, with no behaviour or feedback effects. The literature tests the readings drawn from it, not the profile itself.
Consistent with. The direction of the contrast between spending and taxes: in fiscal consolidations actually observed in 18 industrialised countries, France included, from 1978 to 2009, net income inequality rises; spending cuts appear unfavourable, tax rises equalising, although the latter effect is not significant in the baseline specification (Agnello and Sousa). The postponement of investment: in Breunig and Busemeyer’s sample, a heavier interest burden goes with a decline in the share of public investment in favour of pensions, postponing an investment being politically less costly than cutting an entitlement. The role of use: in Diamond’s model, borrowing to acquire physical capital makes the State a mere intermediary between savers and entrepreneurs, with no effect.
Challenged by. Any reading in which the inherited claim would neutralise the burden: in the efficient case of Diamond’s model, where the interest rate exceeds population growth, domestically held debt lowers long-run welfare more than external debt, because it takes the place of productive capital in people’s wealth. Barro, who defends the opposite view, bases it on voluntary transfers between parents and children, operative for most people, and acknowledges that in 1989 most economists still leaned towards the standard models. The magnitude: in Agnello and Sousa’s breakdown, it is the largest tax rises that are associated with a significant fall in inequality, and the effects tend to disappear within two years. The “tax” curve read as final incidence: in 55,082 firms in nine European countries, from 1996 to 2003, about half of a rise in corporate income tax falls in the long run on wages (Arulampalam, Devereux and Maffini) — a different tax from the one on this page, but the same gap between legal and final incidence.
Not established. That less mobile groups bear more of the adjustment: the corporate tax study measures wage bargaining, and its only mobility contrast, between multinationals and independent firms, is not significant. That only unanticipated inflation transfers the burden: we did not find, in the texts examined, a test separating anticipated from unanticipated inflation. Finally, the page’s “education” exposure has no observed equivalent: a cash income indicator does not directly value a loss of public service.
References read
Agnello, L. and Sousa, R. M., “How Does Fiscal Consolidation Impact on Income Inequality?”, Banque de France working paper no. 382, 2012 (published in the Review of Income and Wealth, 60(4), 2014).
Breunig, C. and Busemeyer, M. R. (2012), “Fiscal austerity and the trade-off between public investment and social spending”, Journal of European Public Policy, 19(6), pp. 921-938.
Arulampalam, W., Devereux, M. P. and Maffini, G., “The Direct Incidence of Corporate Income Tax on Wages”, revised manuscript, February 2012 (published in the European Economic Review, 56(6), 2012).
Diamond, P. A. (1965), “National Debt in a Neoclassical Growth Model”, American Economic Review, 55(5), pp. 1126-1150.
Barro, R. J. (1989), “The Ricardian Approach to Budget Deficits”, Journal of Economic Perspectives, 3(2), pp. 37-54.
Literature review checked on 30 September 2026: every reference cited was read in full on that date, in the version indicated.
What to take away
A question of distribution has no answer in itself; it has one per decision. The incidence of a euro of interest cannot be read anywhere in the accounts, because it is determined elsewhere: in the adjustment chosen that year — tax, spending, inflation, postponement — and in the alternative it is compared with. Naming both turns an opinion into a verifiable statement; naming neither produces an answer that can be neither established nor refuted.
Holding is not paying. The holder of a security advanced the funds and receives a return in exchange; paying the interest falls to the public budget, which can finance it from its revenue or from new borrowing. The distributional question begins after that: which taxes, which spending, what inflation or what restructuring accompany the adjustment, and compared with which alternative. The breakdown of holders tells us where the interest goes, never where it comes from — two questions the same figure cannot settle, hence its two separate panels.
A group average does not describe its members. This is the least intuitive result on this page: a standard-of-living decile can receive more than it pays on average while most of the people in it pay more than they receive — a few very positive balances are enough to carry the average. A statistic by decile therefore answers “how is the total distributed?”, not “what does a person in this decile experience?”.
On generations, only one statement withstands the balance-sheet objection. Whether a debt weighs on or benefits those who come after depends on its use, its financing and the claims passed on: the stock does not say, and the published net debt does not say either, since it deducts only certain financial assets. What remains true in every case is of another order: the decision is taken without those who will bear part of it.
Further reading in this dossier: two applications of "who pays?" (in French)
The charts, the data and a ready-made citation, under an open licence. Each chart carries its source, vintage and reading caveat inside the image: reused in a lecture or an article, it does not come apart from what makes it readable.
Who borrows? Who holds French government securities?
The levels of government that borrow, then the holders of the State's securities: two separate scopes, with no proportional link.
Reading caveat. A: nominal value; B: market value. Holding securities does not measure the final burden.
INSEE, IR no. 79 (27 March 2026), end of 2025 · Banque de France via Agence France Trésor (French Treasury agency), Q1 2026
Net contributors and net beneficiaries by decile, 2023
On average per CU, the lower and middle deciles receive more than they pay in, the best-off the reverse; but from the middle of the scale, most people pay in more than they receive.
Reading caveat. Averages per CU; pensions and public services valued by imputation included; the balance of one year, not of a lifetime; does not measure the specific effect of the debt.
Taxes and contributions, and public transfers, by household age, 2023
In 2023, under these conventions: what each group pays in and receives, ranked by the mean age of the household's adults, pensions and public services included.
Reading caveat. A snapshot of one year, not the balance sheet of a generation nor of future generations; a household's age is not the retirement status of its members.
The same €10 billion adjustment: who would bear it, depending on the decision taken?
What the same adjustment would represent for each standard-of-living decile depending on the decision taken — taxes, pensions or education —, then how much that choice changes what the same group bears.
Reading caveat. An accounting exposure profile, not a simulation: no behaviour, no feedback effect. A cut in a valued public service is not a loss of cash income. The D1 point of the tax decision is excluded; the reason is given in the figure's footer.
Insee, distributional national accounts, table CND.101 (standard-of-living twentieths, 2020-2023, base 2020) — 2023 vintage
Through which channels can the burden be distributed?
Four possible mechanisms, not exhaustive, refinancing, which rolls the maturity over without designating a loser, and alongside what the debt has financed.
Reading caveat. No relative weight or causal effect is measured here.
Lalut, Stéphane (2026). “Who really pays for public debt?”. INSEE and Banque de France via Agence France Trésor data, retrieved 21 September 2026. https://stephane-lalut.com/en/who-really-pays-public-debt/
In three sentences
How the effects of public debt are distributed depends on what it finances, how it is financed and the adjustments chosen to service it; some configurations may shift costs onto groups less able to avoid them. The available data show who borrows, who holds the State’s securities and who contributes or receives today — not who will bear the final burden. A loss can only be attributed to a specific decision, compared with its alternative.
The data
Holdings of public debt (the book's register, sources INSEE and Banque de France) and INSEE's 2023 distributional national accounts, with their periods, units and conventions.
Data and charts CC BY 4.0 — free reuse, including commercial, with attribution. Text under copyright — short quotation free, full reproduction on request. The raw series belong to their producers (INSEE and Banque de France via Agence France Trésor), under their own terms.