From 57.5% to 115.7% of GDP between 1995 and 2025: French public debt doubled. Interest pushed it up by 74.0 points, and nominal GDP growth held it back by almost as much; what remains, in this accounting decomposition, is primary deficits, excluding interest: 50.5 points of a net rise of 58.2, or 87%.
Updated: 30 September 2026 France, general government, Eurostat series from 1995 to 2025. Download: CSV · JSON · method
France is a telling case for a question every indebted country faces. Its debt ratio doubled in thirty years, and Eurostat’s harmonised series allow that rise to be split, year by year, into the terms of a standard accounting identity. The accounting identity is general; the estimates below are for France.
Where the rise comes from
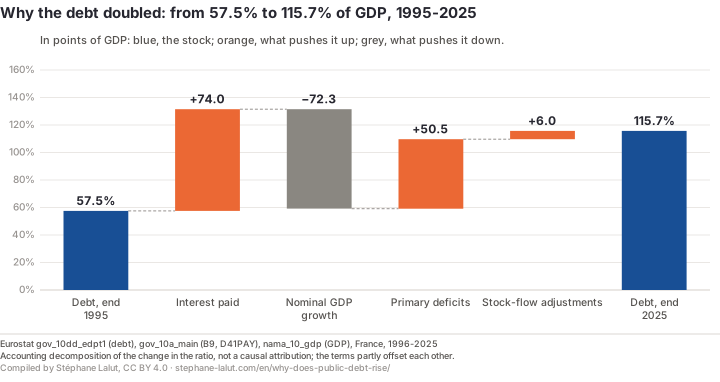
Cumulative decomposition of the change in the debt-to-GDP ratio, France, 1995-2025, in points of GDP (Eurostat). Blue: the stock; orange: what pushes it up; grey: what pulls it down.
The result in one sentence. Over thirty years, interest and nominal GDP growth almost cancelled out (net effect +1.6 points): the rise in the debt comes mostly from primary deficits, 50.5 points out of 58.2. This is an accounting decomposition: it identifies which accounting components contributed to the increase, not why the deficits existed.
One identity, three terms
What moves the debt-to-GDP ratio from one year to the next
the interest-growth effectinterest minus nominal GDP growth+the primary deficitspending minus revenue, excluding interest+stock-flow adjustmentswhat does not pass through the deficit=the change in the ratioin points of GDP
Exact identity: dt − dt−1 = (i − g) / (1 + g) × dt−1 − primary balancet + stock-flowt, where d is the debt-to-GDP ratio, i the implicit interest rate (the year's interest / debt at the end of the previous year) and g nominal GDP growth.
The interest-growth effect. All else equal, the year’s interest adds to the borrowing requirement, and therefore to the debt; but nominal GDP growth — real growth plus inflation — lowers the ratio even without any repayment. The balance of the two is positive when the implicit interest rate exceeds nominal growth, negative in the opposite case.
The primary deficit. The gap between public spending and revenue excluding interest. It does not say whether spending is too high or revenue too low: it measures the gap, not its cause.
Stock-flow adjustments. Debt that moves without passing through the deficit: cash set aside, loans and equity stakes, valuation effects. Here they are obtained as the residual of the identity, then checked against a second accounting identity built on the same series (change in the debt minus the deficit): the two match every year.
Year by year
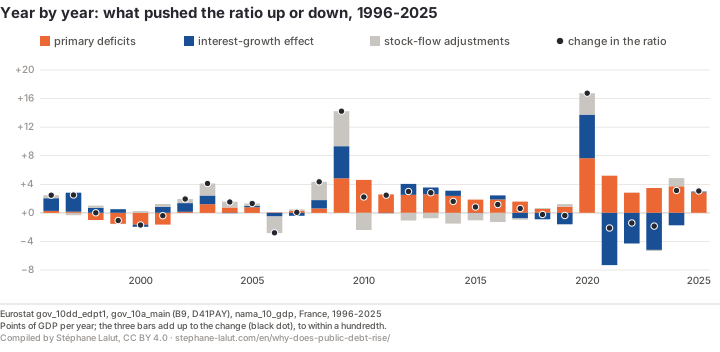
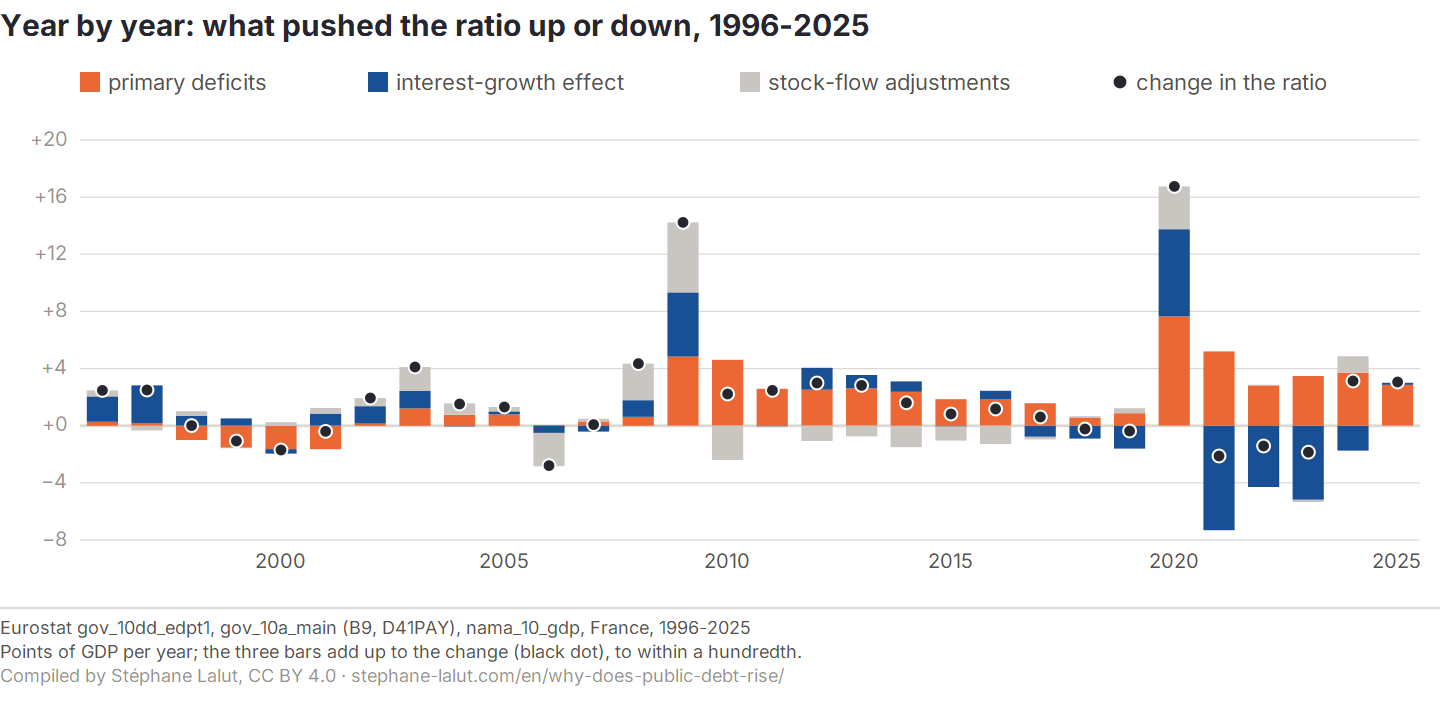
Annual contributions to the change in the debt-to-GDP ratio, France (Eurostat). The three bars add up to the change, marked by the black dot.
Three periods stand out, and the dominant term changes from one to the next.
1996-2007: the interest-growth effect. The ratio gains +8.0 points. The implicit interest rate on the debt then exceeds, on average, nominal growth: the interest-growth effect adds +7.8 points, while the primary balance, close to equilibrium and sometimes in surplus, contributes −2.1.
2008-2019: primary deficits. The ratio gains +32.7 points, of which +26.9 come from primary deficits and +6.1 from the interest-growth effect. The year 2009 alone accounts for 14.2 points: the primary deficit widens and GDP contracts, two effects that coincide with the financial crisis.
2020-2025: nominal growth holds back, deficits push. The ratio gains +17.5 points. In 2020 it jumps by 16.7 points, with the pandemic. From 2021 to 2023, strong nominal GDP growth, driven in particular by inflation, brings the ratio down: the interest-growth effect takes 16.8 points off the ratio, more than primary deficits add (11.5). Since 2024 it has been rising again.
Over the 30 years of the series, the primary balance was in surplus only 4 times. This count describes a recurrence; it does not say whether each of these deficits was desirable, avoidable or cyclical.
What this decomposition does not say
An accounting decomposition, not a causal explanation. It identifies which accounting components moved the debt; it does not say why the deficits existed, or whether they were avoidable.
Terms that are not independent. In a recession, revenue falls and some spending rises: the primary deficit itself depends on growth.
Inflation does not reduce the real burden of nominal debt without cost. It reduces the real value of nominal claims, and that loss is borne by someone: this is the subject of Who really pays for public debt?
Nothing about the future. What comes next depends on the gap between the implicit interest rate and nominal growth, and on the primary balance. In 2025, the implicit rate (2.02%) and nominal growth (1.9%) were almost equal: the interest-growth effect was close to zero (+0.1 points).
A series that starts in 1995. Eurostat’s harmonised interest data go back no further; the long-run debt series, since 1978, is in What does French public debt actually cost?
Frequently asked questions
Why does French public debt rise?
Over 1995-2025, the debt-to-GDP ratio went from 57.5% to 115.7%. Decomposing its change year by year, interest pushed it up by 74.0 points and nominal GDP growth held it back by 72.3: their net effect is only +1.6 points. The rise comes mostly from primary deficits, the gap between public spending and revenue excluding interest (50.5 points), and for the rest from stock-flow adjustments (+6.0). This is an accounting decomposition: it identifies which accounting components contributed to the increase, not why the deficits existed.
Does interest make the debt rise?
All else equal, yes: it adds to the borrowing requirement. But over thirty years nominal GDP growth almost offset it: its accounting contribution is 74.0 points, against 72.3 points of reduction due to nominal growth. That balance depends on the gap between the implicit interest rate on the debt and nominal growth: in 2025 the two were almost equal (2.02% and 1.9%).
Does inflation reduce the debt?
It can reduce the ratio, by increasing nominal GDP faster than the interest bill. From 2021 to 2023, nominal growth — inflation included — produced an interest-growth effect of −16.8 points, while primary deficits added 11.5; this decomposition does not separate the share of inflation from that of real growth. This is not costless: it reduces the real value of nominal claims, and that loss is borne by someone.
Is a primary deficit a sign of too much spending?
Not necessarily: it is a gap between spending and revenue excluding interest, which can come from rising spending, falling revenue, or a recession that does both at once. These data measure the gap; they do not say which of its two terms should be corrected.
Eurostat, general government (S.13), national accounts ESA 2010, in national currency: Maastricht debt (gov_10dd_edpt1), interest paid (gov_10a_main, D41PAY), net lending or borrowing (B9), nominal GDP (nama_10_gdp). The primary balance is the general government balance plus interest paid. Each year, the identity is applied as written above; stock-flow adjustments are the residual, and the script stops if that residual differs from the second accounting identity (change in the debt minus the deficit), computed on the same series. The ratios may differ by a few tenths of a point from first releases (deficit and debt notifications, quarterly accounts), following revisions of the national accounts: this page uses Eurostat’s annual series in their latest version. No figure on this page is entered by hand: all come from the same script, re-run with each release of the sources, which also stops if a sentence on the page ceased to be true.
Reusing this page
The charts, the data and a ready-made citation, under an open licence. Each chart carries its source, vintage and reading caveat inside the image: reused in a lecture or an article, it does not come apart from what makes it readable.
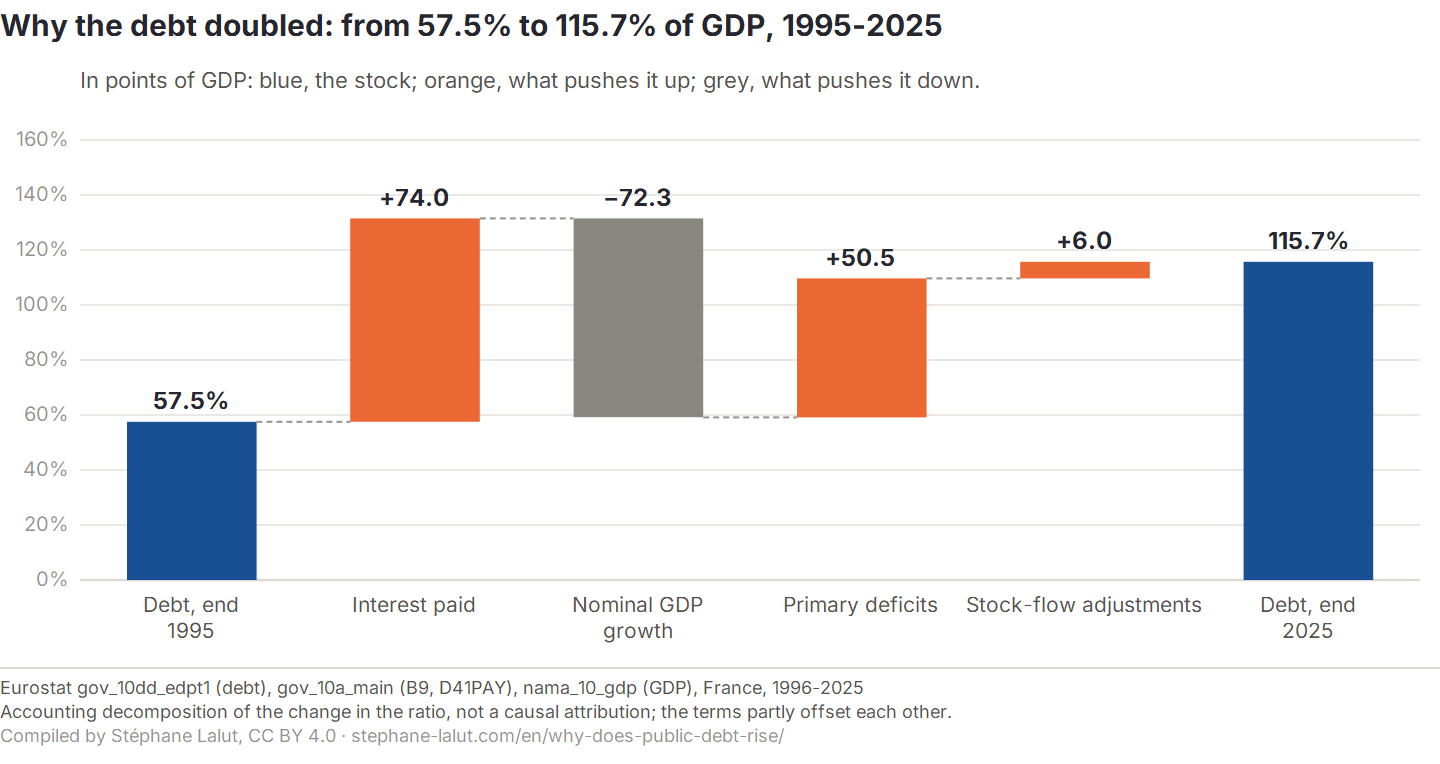
Why the debt doubled: from 57.5% to 115.7% of GDP, 1995-2025
Over the period, interest and nominal growth almost cancelled out; the rise in the debt is mostly due to primary deficits, excluding interest.
Reading caveat. Accounting decomposition of the change in the ratio, not a causal attribution; the terms partly offset each other.
Eurostat gov_10dd_edpt1 (debt), gov_10a_main (B9, D41PAY), nama_10_gdp (GDP), France, 1996-2025
Lalut, Stéphane (2026). “Why does French public debt rise?”. Eurostat data, retrieved September 30, 2026. https://stephane-lalut.com/en/why-does-public-debt-rise/
In three sentences
This page decomposes the change in the French debt-to-GDP ratio, from 1995 to 2025, into the interest effect, the nominal growth effect, the primary balance and stock-flow adjustments. Over the period, interest and nominal growth almost cancelled out, and the rise comes mostly from primary deficits, excluding interest. This is an accounting decomposition, not a causal attribution: it does not say why the deficits existed.
The data
The annual decomposition of the change in the debt-to-GDP ratio, France, with its four terms, the implicit interest rate and nominal growth; the same content is available as CSV, one row per year.
Data and charts CC BY 4.0 — free reuse, including commercial, with attribution. Text under copyright — short quotation free, full reproduction on request. The raw series belong to their producers (Eurostat), under their own terms.